matplotlib中ylabel和xlabel函数
1.语法
matplotlib.pyplot.ylabel(s, *args, **kwargs)
参数:
fontsize:数字或’small’,‘large’,‘medium’
verticalalignment:‘top’, ‘bottom’, ‘center’,‘baseline’
horizontalalignment:‘center’, ‘right’, ‘left’
rotation: ‘vertical’,‘horizontal’
默认:plt.xlabel(fontsize=‘large’,verticalalignment=‘top’,horizontalalignment=‘center’,rotation=‘horizontal’)
plt.ylabel(fontsize=‘large’,verticalalignment=‘bottom’,horizontalalignment=‘center’,rotation=‘vertical’)
2.例子:
参数fontsize的值为为数字时可调节字体大小,也可以填写’small’,‘large’,‘medium’,默认为’large’
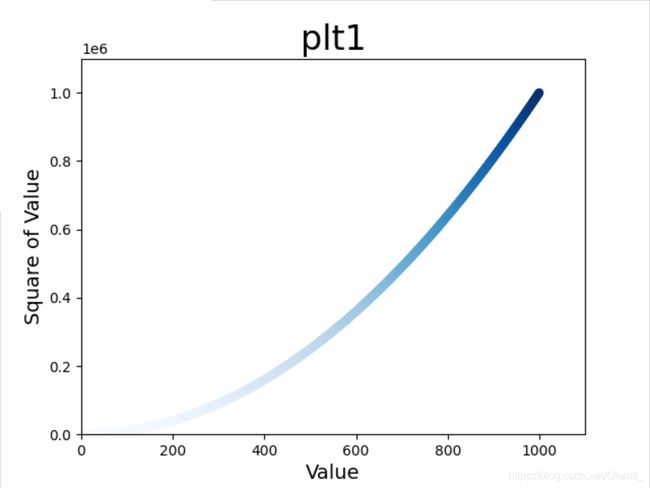
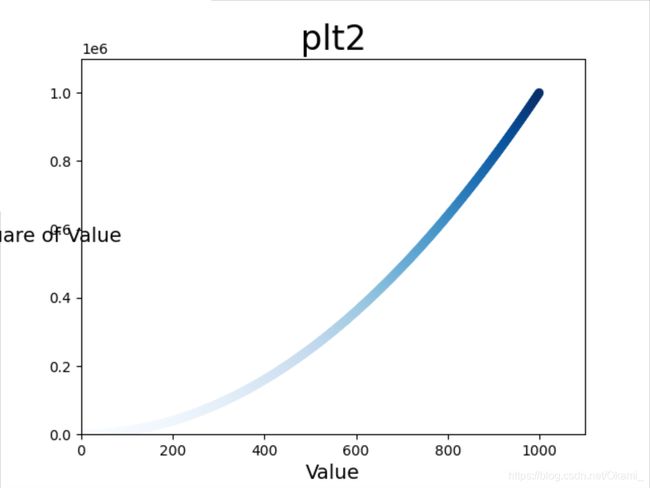
plt1.xlabel("Value",fontsize='small')
plt2.xlabel("Value",fontsize='medium')
plt3.xlabel("Value",fontsize='large')


参数verticalalignment的值为’top’, ‘bottom’, ‘center’,‘baseline’,意思为上下平移向figure与axis之间的中间线对齐,字母底端为‘top’
xlabel与ylabel的默认值不同
plt1.xlabel("Value",fontsize=14,verticalalignment='top')
plt2.xlabel("Value",fontsize=14,verticalalignment='bottom')
plt3.xlabel("Value",fontsize=14,verticalalignment='center')
plt4.xlabel("Value",fontsize=14,verticalalignment='baseline')


参数horizontalalignment为’center’, ‘right’, ‘left’ 意思为左右平移向中间对齐.如’left’,若为xlabel则标识最左边对齐figure的中垂线,若为ylabel则标识最左边对齐figure的中横线
plt1.xlabel("Value",fontsize=14,horizontalalignment='center')
plt2.xlabel("Value",fontsize=14,horizontalalignment='right')
plt3.xlabel("Value",fontsize=14,horizontalalignment='left')


参数rotation的值为 ‘vertical’,‘horizontal’,意思为旋转
plt1.xlabel("Value",fontsize=14,rotation='vertical')
plt2.ylabel("Value",fontsize=14,rotation='horizontal')

旋转后要用到verticalalignment或horizontalalignment时,要注意字母的方向,如
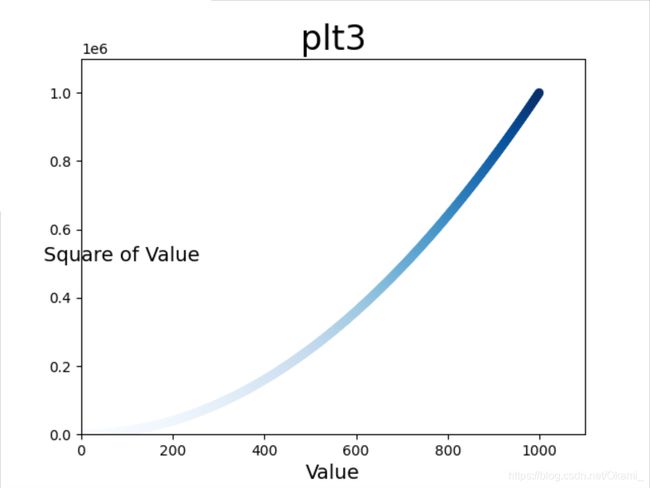
plt.ylabel("Square of Value",
fontsize=14,rotation='horizontal',verticalalignment='top')
而此时再用horizontalalignment对准的线变为figure与axis之间的中线,不再为figure的中横线。
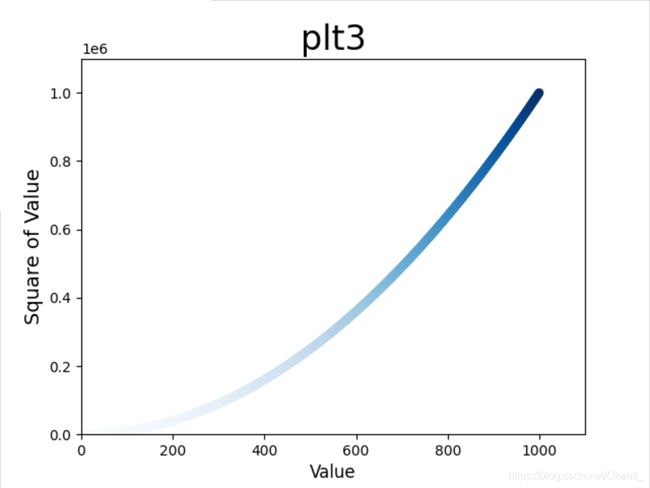
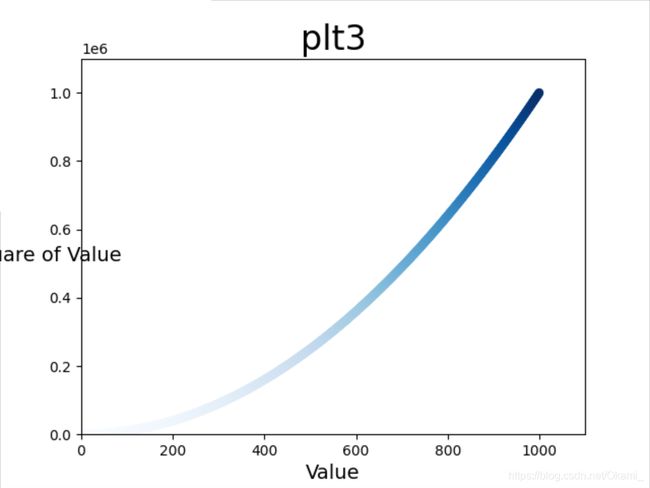
plt3.ylabel("Square of Value",
fontsize=14,rotation='horizontal',
verticalalignment='top',horizontalalignment='left')