Python 與數據資料分析2-Matplotlib.pyplot入門
“Talk is cheap. Show me the code.”
― Linus Torvalds
老子第41章
上德若谷
大白若辱
大方無隅
大器晚成
大音希聲
大象無形
道隱無名
拳打千遍, 身法自然
110_1_高中週期性課程: Python程式入門與資料分析初探, 道明高中
本系列文章之連結
- Python程式與數據資料分析1 link
- Python程式與數據資料分析1.1 Kaggle站免費教學的路徑圖 link
- Python 與數據資料分析2-資料視覺化-Matplotlib.pyplot 入門 link
- Python 與數據資料分析3.1-資料視覺化-基本圖表類型 link
- Python 與數據資料分析3.2-資料視覺化-從 seabon 的函數分類來看 link
- Python與資料分析3.3-資料視覺化-seaborn 補充 link
- Python與資料分析4-資料視覺化-鳶尾花 link
- Python與資料分析 5-入門級競賽分析-鐵達尼號 link
文章目录
- 本系列文章之連結
- Matplotlib的兩種繪圖風格: pyplot 與 物件導向
-
- 用 tuple 的逗號抽出(提取出)傳回來的物件
- Matplotlib.pyplot 的繪圖
-
- 第一個例子 pyplot.plot()
-
- 引入 Matplotlib 程式庫的方式
- 預設是折線圖, 會自動把點之間用線段連接
- 如果想要畫出紅色點圖, 可以指定點的 style
- 第二個例子 多條曲線
-
- 第一種使用多組 x,y
- 第二種使用多個 plt.plot()
- 第三個例子 線的屬性控制 Controlling line properties
- 第四個例子 多個子圖或圖框(畫布) Working with multiple figures and axes
-
- 多個子圖 subplot()
- 多個圖框(畫布) figure()
- 第五個例子 加入文字 text
-
- text()
-
- 可以使用相對座標 axis coords:
- 文字可以加方框, 使用 `bbox`
- 使用數學符號 Using mathematical expressions in text
- 加入註解及箭號 Annotating text
- 第六個例子 如何逐步加入點造成動畫效果
- 最完整的教學與指令表格要看官網
-
- pyplot 初學者使用類似 Matlab 語法
- 物件導向語法方面的說明
- 學習路徑圖: 最完整的教學與指令表要看官網
-
- 學習路徑圖
- pyplot 詳細的指令表格
-
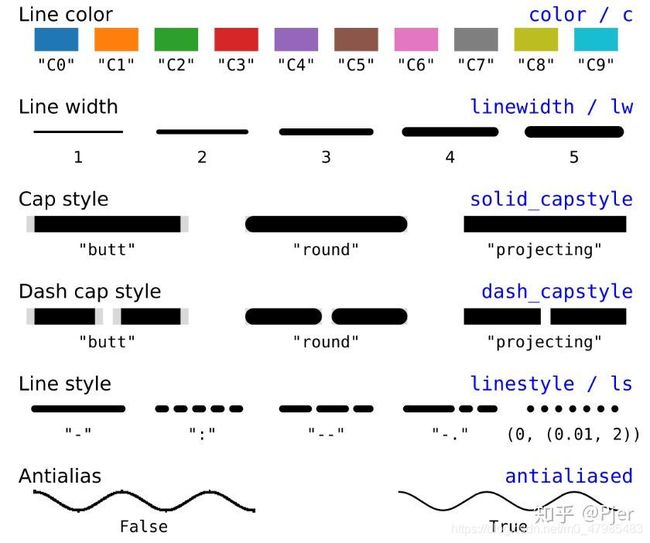
- Line 的格式
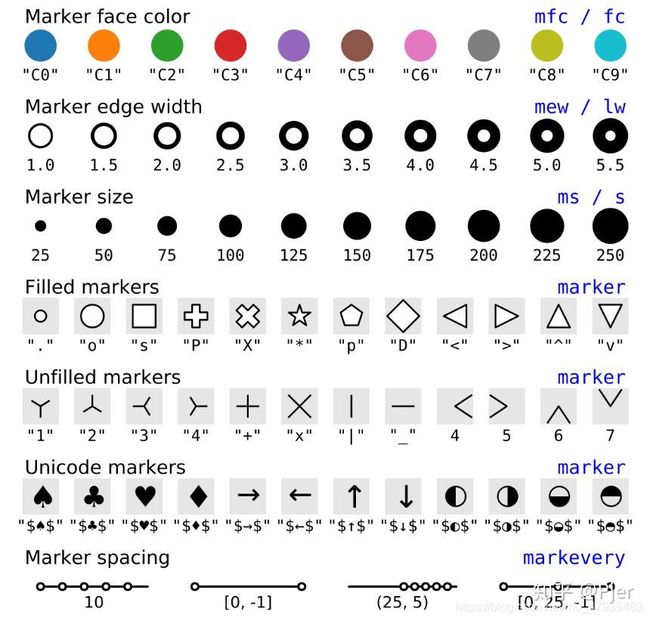
- Marker(點的形狀) 的格式
- Color(顏色) 的格式
-
- 顏色的指定方法
- 顏色之 RGB 與 16進制 與英文名稱之對照總表
- Color Demo 講解顏色的指定方法
- set_linewidth, ()set_color() 等函數列表
- 物件導向語法方面的指令表格
- Matplotlib速查表
- Reference
Matplotlib的兩種繪圖風格: pyplot 與 物件導向
Matplotlib30官網/Tutorials/ Introductory/Usage Guide,
是一整體的初步介紹, 包括簡單的 pylpot 與 物件導向 方式
“This tutorial covers some basic usage patterns and best-practices to help you get started with Matplotlib.”, link
我會建議初學者先學 pyplot 風格的用法, 會較直觀.
在學一段時間之後, 做較個人化的操控時, 則建議進入用物件導向的方式,
pyplot 風格: 類似 Matlab的指令, 方便那些已熟悉 Matlab 的人可以直接享受使用 Matplotlib 的功能.
物件導向方式: 就是先用 pyplot.subplots()產生 figure, axes,
再用 figure, axes 去調整圖形:
在 Usage Guide 中講解的, 物件導向風格與pyplot 風格之舉例:
物件導向風格
就是先用 pyplot.subplots()產生 figure, axes,
再用 figure, axes 去調整圖形:
# 物件導向方式
import matplotlib.pyplot as plt
fig, ax = plt.subplots()
ax.plot(x, x)
pyplot 風格: 直接對屬性(顏色, 線的粗細等)設值
# pyplot
import matplotlib.pyplot as plt
x = np.linspace(0, 2, 100)
plt.plot(x, x, label='linear')
用 tuple 的逗號抽出(提取出)傳回來的物件
We use tuple unpacking with line, to get the first element of that list."
物件導向方式, 會常用到, 用 tuple 的逗號抽出(提取出)傳回來的物件, 例如:
fig, ax = plt.subplots(),
line1, line2 = plot(x1, y1, x2, y2)
Matplotlib.pyplot 的繪圖
官網的說明: Provides a MATLAB-like plotting framework.
pyplot 的設計, 是為了讓 Matplotlib 的部分指令與 Matlab 類似, 方便那些已熟悉 Matlab 的人可以直接享受使用 Matplotlib 的功能.
我會建議初學者先學 pyplot 風格的用法, 會較直觀.
在學一段時間之後, 做較個人化的操控時, 則建議進入用物件導向的方式,
特別注意:
網路上常看到 Matplotlib.pylab 的程式碼, 目前官網已建議不要使用!
根據本人的經驗, 可以不用改程式碼, 直接把檔頭的 import pylab, 改成 pyplot, 也就是
import matplotlib.pylab as plt
改為
import matplotlib.pyplot as plt
通常都可以照常執行!
The pylab API (disapproved停止維護)
Warning
Since heavily importing into the global namespace may result in unexpected behavior, the use of pylab is strongly discouraged. Use matplotlib.pyplot instead.
pylab is a module that includes matplotlib.pyplot, numpy, numpy.fft, numpy.linalg, numpy.random, and some additional functions, all within a single namespace. Its original purpose was to mimic a MATLAB-like way of working by importing all functions into the global namespace. This is considered bad style nowadays.
以下講解內容, 直接參考官網的 Pyplot tutorial link.
第一個例子 pyplot.plot()
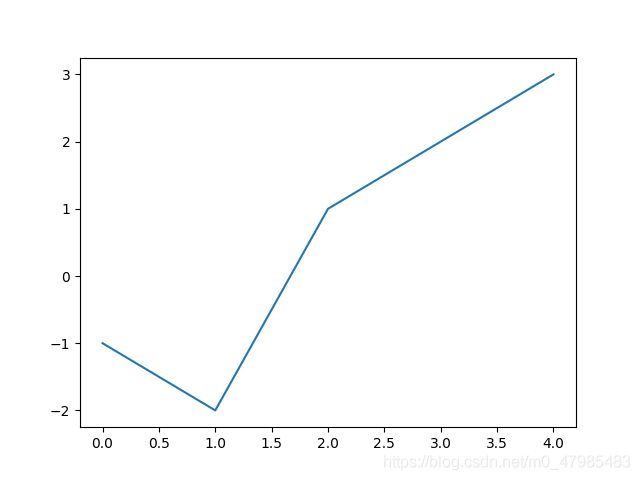
要描點繪圖, 最直接的指令就是 plot(),
如果要畫出 以下5個值
x1 = -1, x2 = -2, x3 = 1, x4 = 2, x5 = 3

就直接下
plot( [-1, -2, 1, 2, 3])
或
plot( [x1, x2, x3, x4, x5])
即可, 注意需要用 list 的中括號 [ ,,, ] 包住 各個點.
注意, 上圖中點的 x 座標, 會自動從 0 開始, 依序 0,1,2,3,4.
如果要畫以下5ˇ個點: (x1, y1), (x2, y2), (x3, y3), (x4, y4), (x5, y5),
則要下 plot( [x1, x2, x3, x4, x5], [y1, y2, y3, y4, y5])
如果令 x 是 x1, x2, x3, x4, x5 形成的 list:
x = [-1, -2, 1, 2, 3],
令 y 是 x 各元素 的 3 次方值, i.e., y = f ( x ) = x 3 y=f(x)=x^3 y=f(x)=x3:
y = [(-1)**3, (-2)**3, 1**3, 2**3, 3**3] (= [-1, -8, 1, 8, 27])
>>> x = [-1, -2, 1, 2, 3]
>>> y = [(-1)**3, (-2)**3, 1**3, 2**3, 3**3]
>>> x
[-1, -2, 1, 2, 3]
>>> y
[-1, -8, 1, 8, 27]
則下
plot(x, y)
也就是, plot 第一個引數為 x 座標的 list, x = [-1, -2, 1, 2, 3],
第二個引數為 y 座標的 list, y = [-1, -8, 1, 8, 27],
但是 plot是 Matplotlib.pyplot 程式庫下的指令,
必須先用 import 引入此 Matplotlib 程式庫,
引入 Matplotlib 程式庫的方式
- 如果引入方式是
from matplotlib import pyplot
則 plot 前須加上pyplot.前綴字, 如下,
pyplot.plot( [x1, x2, x3, x4, x5])
- 另一方式是最常用的引入方式:
import matplotlib.pyplot as plt
則 plot 前須加上plt.如下,
plt.plot( [x1, x2, x3, x4, x5])
import matplotlib.pyplot as plt

x1 = -1
x2 = -2
x3 = 1
x4 = 2
x5 = 3

plt.plot( [x1, x2, x3, x4, x5])

plt.show()
- 如果引入方式是
from matplotlib.pyplot import *
則 pyplot 的指令都不須加前綴字(prefix)pyplot,
一般不建議這樣引入, 因為會無法區分是否是內建的指令.
>>> from matplotlib.pyplot import *
>>> plot(x,y, 'o')
[]
>>> show()
預設是折線圖, 會自動把點之間用線段連接
# pyplot_simple_Lai.py
# pylpot tutorial 的第一個例子

from matplotlib import pyplot

x1 = -1
x2 = -2
x3 = 1
x4 = 2
x5 = 3

pyplot.plot( [x1, x2, x3, x4, x5])

pyplot.show()
如果想要畫出紅色點圖, 可以指定點的 style
如果想要畫出如剛剛一開始的紅色點圖, 可以指定點的 style 用 'ro', r 表示 red 紅色, o 指定為標出較大的點,
plt.plot( [x1, x2, x3, x4, x5], 'or')
import matplotlib.pyplot as plt

x1 = -1
x2 = -2
x3 = 1
x4 = 2
x5 = 3

y1 = x1**3
y2 = x2**3
y3 = x3**3
y4 = x4**3
y5 = x5**3

plt.plot( [x1, x2, x3, x4, x5], 'or')

plt.show()
第二個例子 多條曲線
第一種使用多組 x,y
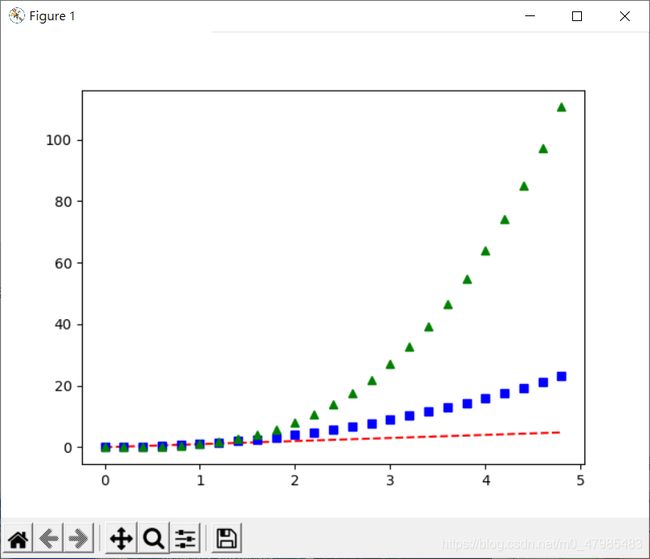
直接以 plot( x1, y1, x2, y2, x3, y3,,,, xn, yn) 來畫出多條曲線, 每條線的 x,y 為1D陣列, 分別為
第一條: x1,y1 ,第二條: x2, y2, 第三條: x3,y3, 等.
其中每個 x1,y1等, 都是數的串列 list, 例如
x1= [x11,x12,x13,,,], y1= [y11,y12,y13,,,].
第二個例子, 呈現三條函數曲線
f 1 ( x ) = x , f 2 ( x ) = x 2 , f 3 ( x ) = x 3 f_1(x)=x,\; f_2(x)=x^2, \; f_3(x)=x^3 f1(x)=x,f2(x)=x2,f3(x)=x3
的增長速度,
想透過不同的點的顏色及形狀來區別三條, 呈現三種函數的走向
# Tutorial pyplot: 第二個例子 多條曲線

import numpy as np
import matplotlib.pyplot as plt

# evenly sampled time at 200ms intervals
t = np.arange(0., 5., 0.2)

# red dashes, blue squares and green triangles
plt.plot(t, t, 'r--', t, t**2, 'bs', t, t**3, 'g^')
plt.show()
第二種使用多個 plt.plot()
另一種方式, 可以參考 Python-Matplotlib可视化(1)一文详解常见统计图的绘制, link
使用多個 plt.plot(), 最後再下 plt.show(), 也可以達到在同一個畫布呈現多條曲線的效果:
## **推薦**, 很棒的系列: Python-Matplotlib可视化(1)一文详解常见统计图的绘制, https://blog.csdn.net/LOVEmy134611/article/details/117301771
## [link](https://blog.csdn.net/LOVEmy134611/article/details/117301771)
# 20210715

# pyplot_multi_curves_2.py
import numpy as np
import matplotlib.pyplot as plt

x = np.linspace(0.1, 2 * np.pi, 30)
y_1 = x
y_2 = np.square(x)
y_3 = x**3

plt.plot(x,y_1, 'r-')
plt.plot(x,y_2, 'bs')
plt.plot(x,y_3, 'go')

plt.show()
第三個例子 線的屬性控制 Controlling line properties
“Lines have many attributes that you can set: linewidth, dash style, antialiased, etc; see matplotlib.lines.Line2D.”
畫線段(折線, 點或曲線等), 有很多屬性可以控制, 例如線的粗細, 顏色, 點的形狀, 反鋸齒狀, 等等.
“There are several ways to set line properties”
以下至少有三種方式指定 plt.plot() 線的屬性:
- 直接指定屬性的值 Use keyword args :
例如, 指定 線的粗細是 2.0 下linewidth=2.0:
plt.plot(x, y, linewidth=2.0) - 使用設定的函數
set_color(color)等 Use the setter methods of a Line2D instance,
例如set_color(color)可以設定顏色,set_linestyle()可以設定是虛線或實線, 等等.
這種方式會較複雜, 初學可以等之後再學, 必須先取出圖的物件, 再用點語法結合set_color(color)等函數, 做設定,
必須先了解, 如果 plot()是畫兩條線, 則傳回來是兩個物件, 此時用 tuple 的逗號抽出(提取出)傳回來的物件, 例如:
line1, line2 = plot(x1, y1, x2, y2)
就會把第一條線的物件放在 line1, 第二條線的物件放在 line2,
“plot returns a list of Line2D objects; e.g., line1, line2 = plot(x1, y1, x2, y2). In the code below we will suppose that we have only one line so that the list returned is of length 1. We use tuple unpacking with line, to get the first element of that list:”- 例如, 以下我們先用 line, = plt.plot(x, y, ‘-’), 提取出 plot 畫出的直線物件
line, = plt.plot(x, y, '-'),
再用 set_color()重設直線物件 line 顏色為 red
line.set_color('red'):
- 例如, 以下我們先用 line, = plt.plot(x, y, ‘-’), 提取出 plot 畫出的直線物件
import matplotlib.pyplot as plt
import numpy as np
x = np.arange(5)
y = np.sin(x)
fooline, = plt.plot(x, y, '-')
fooline.set_color('red')
plt.show()

3. 使用 setp() 函數 “Use the setp() command. The example below uses a MATLAB-style command to set multiple properties on a list of lines. setp works transparently with a list of objects or a single object. You can either use python keyword arguments or MATLAB-style string/value pairs.”
setp() 函數可以一次對很多屬性做設定, 下面同時對 color, linewidth 兩個屬性做設定, 一樣, 還是得先提取出 plot 畫出的直線物件
foolines = plt.plot(x1, y1, x2, y2)
再用 plt.setp() 設定
plt.setp(foolines, color='r', linewidth=2.0)
以下是 Matlab 風格, 也可以
plt.setp(foolines, 'color', 'r', 'linewidth', 2.0)
import matplotlib.pyplot as plt
import numpy as np

x1 = np.arange(0,5,0.1)
y1 = np.sin(x1)
x2 = np.arange(0,5,0.1)
y2 = np.cos(x2)
foolines = plt.plot(x1, y1, x2, y2)
# use keyword args
plt.setp(foolines, color='r', linewidth=2.0)
# or MATLAB style string value pairs
plt.setp(foolines, 'color', 'r', 'linewidth', 2.0)
plt.show()

To get a list of settable line properties, call the setp() function with a line or lines as argument
In [69]: lines = plt.plot([1, 2, 3])

In [70]: plt.setp(lines)
  alpha: float
  animated: [True | False]
  antialiased or aa: [True | False]
  ...snip
2D 線的屬性的表格The kwargs are Line2D properties:
以下只列舉一二, 詳細的表格可以看後面的 “學習路徑圖”.
| Property | Description |
|---|---|
| alpha 透明度 | float (0.0 transparent through 1.0 opaque) |
| animated | [True | False] |
| antialiased or aa | [True | False] |
| color or c | any matplotlib color |
| label | string or anything printable with ‘%s’ conversion. |
| linestyle or ls | [‘solid’ ‘dashed’, ‘dashdot’, ‘dotted’ | (offset, on-off-dash-seq) | ‘-’ | ‘–’ | ‘-.’ | ‘:’ | ‘None’ | ’ ’ | ‘’] |
| linewidth or lw | float value in points |
| marker | A valid marker style |
| markersize or ms | float |
See set_linestyle() for a decription of the line styles, set_marker() for a description of the markers, and set_drawstyle() for a description of the draw styles.
Ref: plt.plot() 2D 線的屬性可以查 matplotlib.lines.Line2D link
set_linewidth(), set_color() 等函數列表
以下只列舉一二, 詳細的表格可以看後面的 “學習路徑圖”.
| Property | Description |
|---|---|
| set_antialiased(b) | True if line should be drawin with antialiased rendering ACCEPTS: [True | False] |
| set_c(val) | alias for set_color |
| set_color(color) | Set the color of the line ACCEPTS: any matplotlib color |
| set_linestyle(ls) | Set the linestyle of the line (also accepts drawstyles, e.g., ‘steps–’) ACCEPTS: [‘solid’ | ‘dashed’, ‘dashdot’, ‘dotted’ |(offset, on-off-dash-seq) | ‘-’ | ‘–’ | ‘-.’ | ‘:’ | ‘None’ | ’ ’ | ‘’] |
| set_linewidth(w) | Set the line width in points ACCEPTS: float value in points |
| set_marker(marker) | Set the line marker ACCEPTS: A valid marker style |
| set_markersize(sz) | Set the marker size in points ACCEPTS: float |
| set_xdata(x) | Set the data np.array for x ACCEPTS: 1D array |
| set_ydata(y) | Set the data np.array for y ACCEPTS: 1D array |
Ref: 以上, plt.plot() 2D 線的屬性表 set_color()等 可以查 matplotlib.lines.Line2D link
第四個例子 多個子圖或圖框(畫布) Working with multiple figures and axes
多個子圖 subplot()
- 官網的例子
產生一個圖框(畫布), 以下plt.figure(1)指令是預設的, 可以不寫
plt.figure(1)
產生兩個子圖, 2 橫排row, 1 直排column, 即 2 乘 1, 就下
plt.subplot(211)
,
plt.subplot(212)
,
211 表示 2 乘 1 ( 2橫排, 1 直排, 2 個 row, 1 個 column), 的第 1 幅子圖
212 表示 2 乘 1, 的第 2 幅子圖
# 20210710
# pyplot tutorial subplot()

import numpy as np
import matplotlib.pyplot as plt

def f(t):
    return np.exp(-t) * np.cos(2*np.pi*t)

t1 = np.arange(0.0, 5.0, 0.1)
t2 = np.arange(0.0, 5.0, 0.02)

plt.figure(1) # 此指令是預設的, 可以不寫

plt.subplot(211)
plt.plot(t1, f(t1), 'bo', t2, f(t2), 'r')

plt.subplot(212)
plt.plot(t2, np.cos(2*np.pi*t2), 'p--')
plt.show()
如果要產生6個子圖, 2 橫排row, 3 直排column, , 即 2 乘 3, 就下
plt.subplot(231)
,
plt.subplot(232)
,
,
plt.subplot(236)
231 表示 2 乘 3 (2 橫排, 3 直排, 2 個 row, 3 個 column), 的第 1 幅子圖
232 表示 2 乘 3, 的第 2 幅子圖
,
,
236 表示 2 乘 3, 的第 6 幅子圖
以下呈現 六條函數曲線的增長速度,
f 1 ( x ) = x , f 2 ( x ) = x 2 , f 3 ( x ) = x 3 , f 4 ( x ) = x 4 , f 5 ( x ) = x 5 , f 6 ( x ) = x 6 f_1(x)=x,\; f_2(x)=x^2, \; f_3(x)=x^3, f_4(x)=x^4, f_5(x)=x^5, f_6(x)=x^6 f1(x)=x,f2(x)=x2,f3(x)=x3,f4(x)=x4,f5(x)=x5,f6(x)=x6
# By Prof. P-J Lai MATH NKNU 20210710
# pyplot tutorial subplot(231)

import numpy as np
import matplotlib.pyplot as plt

t = np.arange(0.0, 40.0, 0.1)
y1 = t
y2 = t**2
y3 = t**3
y4 = t**4
y5 = t**5
y6 = t**6

plt.figure(1) # 此指令是預設的, 可以不寫

plt.subplot(231)
plt.plot(t, y1, 'bo')

plt.subplot(232)
plt.plot(t, y2, 'ro')

plt.subplot(233)
plt.plot(t, y3, 'yo')

plt.subplot(234)
plt.plot(t, y4, 'go')

plt.subplot(235)
plt.plot(t, y5, 'co')

plt.subplot(236)
plt.plot(t, y6, 'ko')

plt.show()
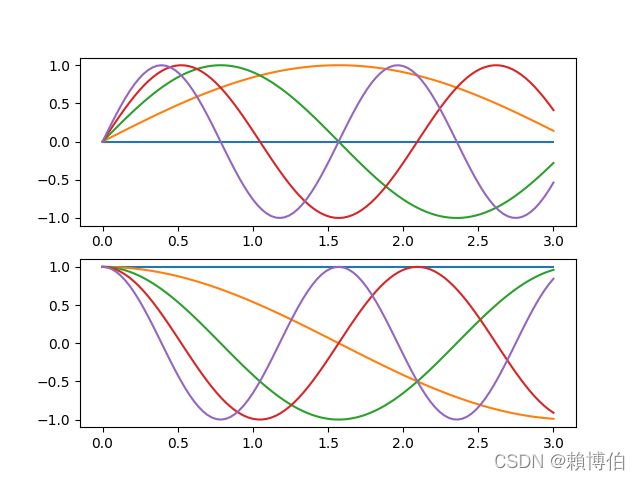
- 張若愚 5.1.4 的例子
多個子圖單一figure
# -*- coding: utf-8 -*-
# ref 張若愚的例子,5.1.4, matplotlib_multi_figure.py
# 5_1_4_多個子圖單一figure_matplotlib_multi_figure.py
import numpy as np
import matplotlib.pyplot as plt

#plt.figure(1) # 建立圖表1, 此行為預設可省略

ax1 = plt.subplot(211) # 在圖表1中建立子圖1
ax2 = plt.subplot(212) # 在圖表1中建立子圖2

x = np.linspace(0, 3, 100)
#for i in xrange(5):
for i in np.arange(5):
    plt.sca(ax1)    # 選取圖表1的子圖1
    plt.plot(x, np.sin(i*x))
    plt.sca(ax2)  # 選取圖表1的子圖2
    plt.plot(x, np.cos(i*x))

plt.show()
多個圖框(畫布) figure()
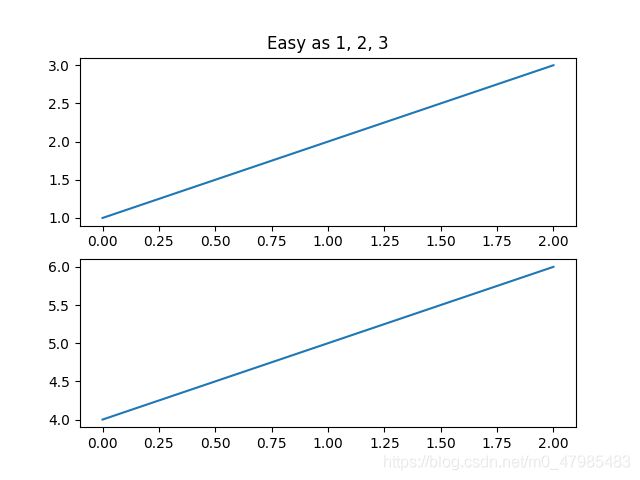
- 官網的例子
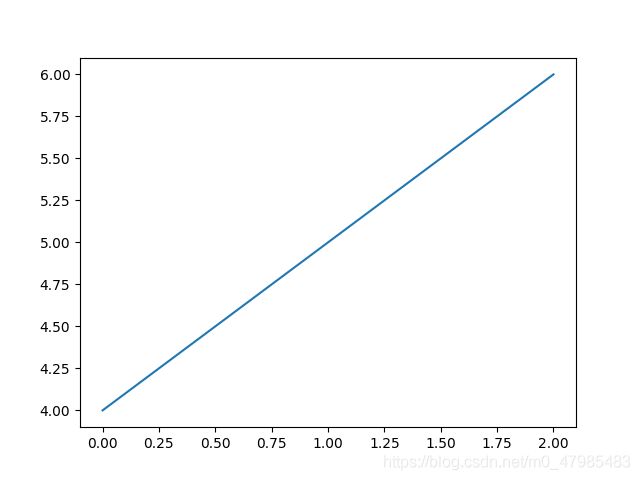
如果要同時呈現有, 例如2個畫布, 就下
plt.figure(1) ⋯ \cdots ⋯ plt.figure(2) … \dots …
中間夾著該畫布的繪圖內容
plt.figure(1)
⋯ \cdots ⋯ (畫布1的繪圖指令)
plt.figure(2)
⋯ \cdots ⋯ (畫布2的繪圖指令)
plt.show()
##You can create multiple figures by using multiple figure() calls
##with an increasing figure number. Of course,
##each figure can contain as many axes and subplots
##as your heart desires:

import matplotlib.pyplot as plt
plt.figure(1)                # the first figure
plt.subplot(211)             # the first subplot in the first figure
plt.plot([1, 2, 3])
plt.subplot(212)             # the second subplot in the first figure
plt.plot([4, 5, 6])

plt.figure(2)                # a second figure
plt.plot([4, 5, 6])          # creates a subplot(111) by default

plt.figure(1)                # figure 1 current; subplot(212) still current
plt.subplot(211)             # make subplot(211) in figure1 current
plt.title('Easy as 1, 2, 3') # subplot 211 title

plt.show()
- 張若愚 5.1.4 的例子
多個 figure 多個子圖
# -*- coding: utf-8 -*-
# ref: 張若愚,  5.1.4, matplotlib_multi_figure.py
# 5_1_4_多個子圖多個figure_matplotlib_multi_figure.py

import numpy as np
import matplotlib.pyplot as plt

plt.figure(1) # 建立圖表1
plt.figure(2) # 建立圖表2
ax1 = plt.subplot(211) # 在圖表2中建立子圖1
ax2 = plt.subplot(212) # 在圖表2中建立子圖2

x = np.linspace(0, 3, 100)
#for i in xrange(5):
for i in np.arange(5):
    plt.figure(1)   # 選取圖表1
    plt.plot(x, np.exp(i*x/3))
    plt.sca(ax1)    # 選取圖表2的子圖1
    plt.plot(x, np.sin(i*x))
    plt.sca(ax2)  # 選取圖表2的子圖2
    plt.plot(x, np.cos(i*x))

plt.show()
第五個例子 加入文字 text
The text() command can be used to add text in an arbitrary location, and the xlabel(), ylabel() and title() are used to add text in the indicated locations (see Text introduction for a more detailed example)
text()指令可以在任意地方插入文字, 而xlabel()為加入 x-軸 的說明,ylabel()為加入 y-軸 的說明,tile()則為加入圖的標題(主題)
text()
matplotlib.pyplot.text(x, y, string, fontdict=None, withdash=False, **kwargs)
可以參考官網說明 plt.text() https://matplotlib.org/2.0.2/api/pyplot_api.html#matplotlib.pyplot.text link
>>> text(x, y, s, fontsize=12)
以上 string 是要插入的字串(要用 ’ ’ 包住), x,y 是座標
withdash 應該已取消:
AttributeError: ‘Text’ object has no property ‘withdash’
以下我們照官網的例子 pyplot_text.py, 改成較簡單的例子, 即畫出
s i n ( x ) + n o i s e 噪 聲 sin(x)+ noise噪聲 sin(x)+noise噪聲
並加上文字說明
plt.text(3.14/4, np.sin(3.14/4)+ 0.7 , 'sin with normal random')
文字位在座標為 (3.14/4, np.sin(3.14/4)+ 0.7) 之處, 即
( π 4 , s i n ( π 4 ) + 0.7 ) (\frac{\pi}{4}, \; sin(\frac{\pi}{4}) + 0.7) (4π,sin(4π)+0.7) 處.
# By Prof. P-J Lai MATH NKNU 20210714
# 以下我們照官網的例子 pyplot_text.py, 改成較簡單的例子

import numpy as np
import matplotlib.pyplot as plt
# Fixing random state for reproducibility
np.random.seed(19680801)
x = np.arange(0, 10, 0.01)
# 噪聲 noise: mu=0, sigma=0.1 之正規分布之隨機數
# 以下是 sin 值加上 振幅 0.1 的 noise
y = np.sin(x) + 0.1*np.random.randn(len(x))

plt.plot(x,y)
plt.xlabel('x')
plt.ylabel('sin')
plt.title('sin with noise')
plt.text(3.14/4,  np.sin(3.14/4)+ 0.7 , 'sin with normal random')
plt.axis([0, 10, -2, 2])
plt.grid(True)
plt.show()


#############################
# 官網的原來的例子, 是畫出 plt.bar() 直方圖
# pyplot_text.py
import numpy as np
import matplotlib.pyplot as plt
# Fixing random state for reproducibility
np.random.seed(19680801)
# 如果要產生10000個正規分布之 mu =100, 變異數=15, 則下:
mu, sigma = 100, 15
x = mu + sigma * np.random.randn(10000)
# the histogram of the data
n, bins, patches = plt.hist(x, 50, normed=1, facecolor='g', alpha=0.75)

plt.xlabel('Smarts')
plt.ylabel('Probability')
plt.title('Histogram of IQ')
plt.text(60, .025, r'$\mu=100,\ \sigma=15$')
plt.axis([40, 160, 0, 0.03])
plt.grid(True)
plt.show()
可以使用相對座標 axis coords:
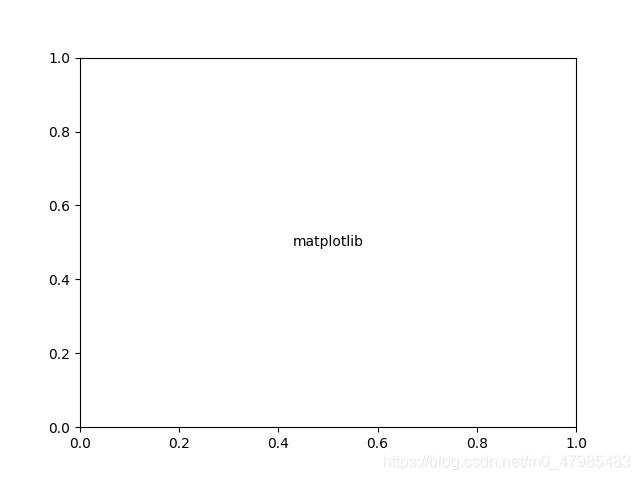
預設是使用一般的座標, 你也可以指定 axis coords, (0,0) 表示左下角, (1,1) 表示右上角, 而 (0.5, 0.5) 表示圖片正中間
The default transform specifies that text is in data coords, alternatively, you can specify text in axis coords (0,0 is lower-left and 1,1 is upper-right). The example below places text in the center of the axes:
以下就是用 (0.5, 0.5) 表示圖片正中間:
plt.text(0.5, 0.5,'matplotlib',,,
import matplotlib.pyplot as plt
fig, ax = plt.subplots()
plt.text(0.5, 0.5,'matplotlib', horizontalalignment='center',verticalalignment='center',transform=ax.transAxes)
plt.show()
文字可以加方框, 使用 bbox
You can put a rectangular box around the text instance (e.g., to set a background color) by using the keyword bbox. bbox is a dictionary of Rectangle properties. For example:

import matplotlib.pyplot as plt
#fig, ax = plt.subplots()
plt.text(0.5, 0.5, 'test', bbox=dict(facecolor='red', alpha=0.5))
plt.show()
使用數學符號 Using mathematical expressions in text
matplotlib accepts TeX equation expressions in any text expression. For example to write the expression σ = 15 \sigma=15 σ=15 in the title, you can write a TeX expression surrounded by dollar signs:
在字串前加個 r, 再使用 Latex 語法, 就可以呈現數學符號, 例如要在 標題加入 σ = 15 \sigma=15 σ=15, 就下:
plt.title(r'$\sigma_i=15$')
我們將一開始的例子改成加入 Latex語法呈現 數學符號:
底下程式碼 plt.ylabel() 沒改到, 故還是呈現一般的文字型態
plt.title(r'$\sin(x^2)$ with noise')
plt.text(3.14/4, np.sin(3.14/4)+ 0.7 , r'$sin(x^2)$ with $N(0,0.1)$ normal random')

# By Prof. P-J Lai MATH NKNU 20210714
# 以下我們照官網的例子 pyplot_text.py, 改成較簡單的例子
# sin(x^2) 加入 Latex語法呈現 數學符號
# pyplot_text_Math_Lai.py

import numpy as np
import matplotlib.pyplot as plt

# Fixing random state for reproducibility
np.random.seed(19680801)

x = np.arange(0, 10, 0.01)
# 噪聲 noise: mu=0, sigma=0.1 之正規分布之隨機數
# 以下是 sin 值加上 振幅 0.1 的 noise
y = np.sin(x*x) + 0.1*np.random.randn(len(x))

plt.plot(x,y)
plt.xlabel('x')
plt.ylabel('sin(x^2)')
plt.title(r'$\sin(x^2)$ with noise')
plt.text(3.14/4,  np.sin(3.14/4)+ 0.7 , r'$sin(x^2)$ with $N(0,0.1)$ normal random')
plt.axis([0, 10, -2, 2])
plt.grid(True)
plt.show()
加入註解及箭號 Annotating text
import numpy as np
import matplotlib.pyplot as plt

ax = plt.subplot(111)

t = np.arange(0.0, 5.0, 0.01)
s = np.cos(2*np.pi*t)
line, = plt.plot(t, s, lw=2)

plt.annotate('local max', xy=(2, 1), xytext=(3, 1.5),
            arrowprops=dict(facecolor='black', shrink=0.05),
            )

plt.ylim(-2,2)
plt.show()
第六個例子 如何逐步加入點造成動畫效果
可以用多個
ax.plot 或是 plt.plot,
中間插入 plt.pause(2) (例如暫停2秒),
最後要下 plt.show()
就會呈現逐步加入點的動畫效果
# How to plot additional points on the top of scatter plot?
# https://stackoverflow.com/questions/44505762/how-to-plot-additional-points-on-the-top-of-scatter-plot

import matplotlib.pyplot as plt
import numpy as np

ax = plt.subplot(1, 1, 1)
ax.scatter([1, 2, 3], [1, 2, 3])
plt.pause(2)
ax.plot(1.5, 1.5, "or")

plt.pause(2)
ax.annotate("Some explanation",(1, 1)  )

plt.show()
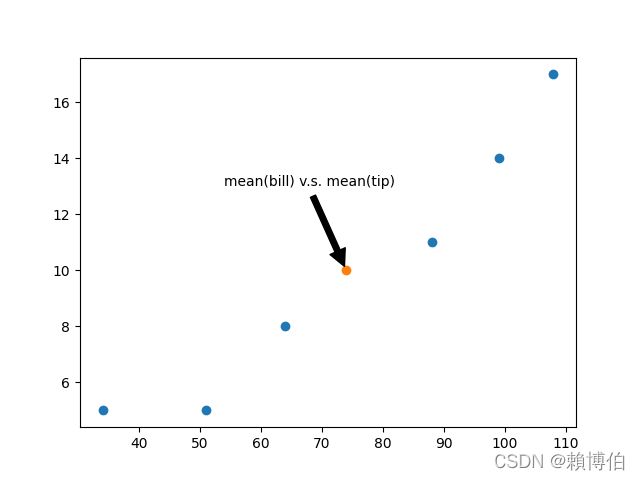
# How to plot additional points on the top of scatter plot?
# https://stackoverflow.com/questions/44505762/how-to-plot-additional-points-on-the-top-of-scatter-plot

import matplotlib.pyplot as plt
import numpy as np

from matplotlib import pyplot as plt
from statistics import *

bill = [34.00, 108.00, 64.00, 88.00, 99.00, 51.00]
tip = [ 5.00,  17.00,  11.00, 8.00,  14.00, 5.00]

bill.sort()
tip.sort()

print(mean(bill))
print(mean(tip))
plt.scatter(bill, tip)
plt.pause(2)
plt.scatter([mean(bill)], [mean(tip)])
plt.pause(2)
#ax.annotate("mean(bill) v.s. mean(tip)",(mean(bill), mean(tip))  )
plt.annotate("mean(bill) v.s. mean(tip)",(mean(bill), mean(tip)), xytext=(mean(bill)-20, mean(tip)+3), arrowprops=dict(facecolor='black', shrink=0.05)  )
plt.show()

plt.show()
最完整的教學與指令表格要看官網
在剛學 pyplot 時, 初學者,
- 手邊最好備好詳細的指令表格, 以供隨時查閱,
- 直接看教學範例, 照著範例打一遍, 是最快的方式,
- 所以注意一下官網的網頁文件, 教學,各指令表格 與 各範例附原始碼 三路的方向, 熟悉路徑, 隨時可以查閱!
最完整的教學與各類指令與屬性之表格與說明, 還是要看官網的網頁文件, 分為教學與各指令表格兩路.
-
教學區, Matplotlib30官網/Tutorials,
在主頁: https://matplotlib.org/Tutorilas, 都可以在 Tutorials 下找到, link
分入門中階高階等教學初中高階, 等,
Pyplot 放在 Introductory入門區, -
各指令之完整說明, 在主頁: https://matplotlib.org/, 找尋 API Overview 的字, link
-
各範例附原始碼, 在主頁: https://matplotlib.org/, 點選 Example link
這裡有初階到高階的各種範例附原始碼, 初學者可以從圖形找自己要的例子, 觀摩原始碼.
pyplot 初學者使用類似 Matlab 語法
手邊最好備好詳細的指令表格
matplotlib.pyplot: https://matplotlib.org/2.0.2/api/pyplot_api.html link
pyplot 較常用的 plot 的詳細指令與屬性之說明 https://matplotlib.org/stable/api/_as_gen/matplotlib.pyplot.plot.html#matplotlib.pyplot.plot link:
物件導向語法方面的說明
在做較個人化的操控時, 建議用物件導向的方式,
https://matplotlib.org/stable/api/#the-object-oriented-api link,
後面的閱讀指引指出: 較常用的是 matplotlib.axes, matplotlib.figure 的指令, 而 "Gallery" link 的例子多半是物件導向的.
詳細內容請參閱後面最後一節: 學習路徑圖: 最完整的教學與指令表要看官網
學習路徑圖: 最完整的教學與指令表要看官網
然而最完整的各類指令與屬性之說明, 還是要看官網的網頁文件, 分為教學,各指令表格 與 各範例附原始碼 三路.
-
教學區, Matplotlib30官網/Tutorials,
在主頁: https://matplotlib.org/Tutorilas, 都可以在 Tutorials 下找到, link
分入門中階高階等教學初中高階, 等,
Pyplot 放在 Introductory入門區,Introductory入門區有
- Pyplot: 初學者可以從此開始
Matplotlib 3.4.2 官網/Tutorials/ Introductory/Pyplot,
專門介紹 Pyplot, link - Usage Guide:
Matplotlib30官網/Tutorials/ Introductory/Usage Guide,
是一整體的初步介紹, 包括簡單的物件導向方式
“This tutorial covers some basic usage patterns and best-practices to help you get started with Matplotlib.”, link
所謂物件導向方式, 就是先用 pyplot.subplots()產生 figure, axes, 再用 figure, axes 去調整圖形:
- Pyplot: 初學者可以從此開始
在 Usage Guide 中講解的, 物件導向風格與pyplot 風格之舉例:
物件導向風格: 就是先用 pyplot.subplots()產生 figure, axes,
再用 figure, axes 去調整圖形:
# 物件導向方式
import matplotlib.pyplot as plt
fig, ax = plt.subplots()
ax.plot(x, x)
pyplot 風格
# pyplot
import matplotlib.pyplot as plt
x = np.linspace(0, 2, 100)
plt.plot(x, x, label='linear')
-
各指令之完整說明與表格, 在主頁: https://matplotlib.org/, 找尋 API Overview 的字, https://matplotlib.org/stable/api/#api-overview link
分- Usage patterns
- The pyplot API
- The object-oriented API
- The pylab API (disapproved已停止維護)
- Modules
- Toolkits
- Usage patterns
-
各範例附原始碼, 在主頁: https://matplotlib.org/, 點選 Example, https://matplotlib.org/stable/gallery/index.html link
這裡有初階到高階的各種範例附原始碼, 初學者可以從圖形找自己要的例子, 觀摩原始碼.
3.4.2 版的 Example 仍沿襲舊稱, 叫 Gallery, 舊版右面較雜駁, 而 新版 3.4.2 則整理為 Lines, Statistics,Pyplot, Animation, 各類較方便查詢.
Table of Contents
Gallery
Lines, bars and markers
Images, contours and fields
Subplots, axes and figures
Statistics
Pie and polar charts
Text, labels and annotations
Pyplot
Color
Shapes and collections
Style sheets
Axes Grid
Axis Artist
Showcase
Animation
Event handling
Front Page
Miscellaneous
3D plotting
Scales
Specialty Plots
Ticks and spines
Units
Embedding Matplotlib in graphical user interfaces
Userdemo
Widgets
學習路徑圖
將以上彙整為學習路徑圖,
區分為教學,各指令表格 與 各範例附原始碼 三路:
Ref: 以上繪製流程图之語法參考: CSDN Markdown Mermaid 流程图示例, https://blog.csdn.net/qwfys200/article/details/84887665
pyplot 詳細的指令表格
手邊最好備好詳細的指令表格
matplotlib.pyplot: https://matplotlib.org/2.0.2/api/pyplot_api.html link
pyplot 較常用的 plot 的詳細指令與屬性之說明 https://matplotlib.org/stable/api/_as_gen/matplotlib.pyplot.plot.html#matplotlib.pyplot.plot link:
Line 的格式
2D 線的屬性的表格The kwargs are Line2D properties:
| Property | Description |
|---|---|
| agg_filter | unknown |
| alpha | float (0.0 transparent through 1.0 opaque) |
| animated | [True |
| antialiased or aa | [True |
| axes | an Axes instance |
| clip_box | a matplotlib.transforms.Bbox instance |
| clip_on | [True |
| clip_path | [ (Path, Transform) |
| color or c | any matplotlib color |
| contains | a callable function |
| dash_capstyle | [‘butt’ |
| dash_joinstyle | [‘miter’ |
| dashes | sequence of on/off ink in points |
| drawstyle | [‘default’ | ‘steps’ | ‘steps-pre’ | ‘steps-mid’ | ‘steps-post’] |
| figure | a matplotlib.figure.Figure instance |
| fillstyle | [‘full’ | ‘left’ | ‘right’ | ‘bottom’ | ‘top’ | ‘none’] |
| gid | an id string |
| label | string or anything printable with ‘%s’ conversion. |
| linestyle or ls | [‘solid’ | ‘dashed’, ‘dashdot’, ‘dotted’ | (offset, on-off-dash-seq) | ‘-’ | ‘–’ | ‘-.’ | ‘:’ | ‘None’ | ’ ’ | ‘’] |
| linewidth or lw | float value in points |
| marker | A valid marker style |
| markeredgecolor or mec | any matplotlib color |
| markeredgewidth or mew | float value in points |
| markerfacecolor or mfc | any matplotlib color |
| markerfacecoloralt or mfcalt | any matplotlib color |
| markersize or ms | float |
| markevery | [None | int | length-2 tuple of int |
| path_effects | unknown |
| picker | float distance in points or callable pick function fn(artist, event) |
| pickradius | float distance in points |
| rasterized | [True | False | None], Defaults to None, |
| sketch_params | unknown |
| snap | unknown |
| solid_capstyle | [‘butt’ |
| solid_joinstyle | [‘miter’ |
| transform | a matplotlib.transforms.Transform instance |
| url | a url string |
| visible | [True |
| xdata | 1D array |
| ydata | 1D array |
| zorder | any number |
See set_linestyle() for a decription of the line styles, set_marker() for a description of the markers, and set_drawstyle() for a description of the draw styles.
Ref: 以上, plt.plot() 2D 線的屬性表可以查 matplotlib.lines.Line2D link
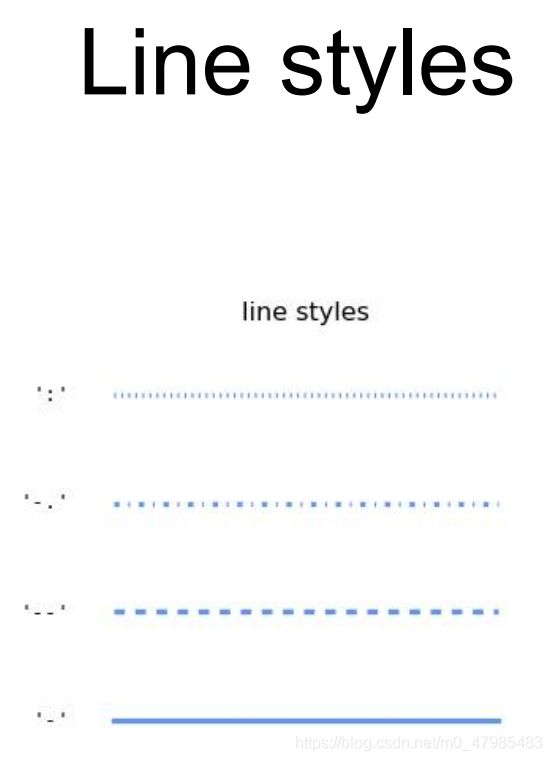
- 線的格式, 實線或虛線等 set_linestyle(ls)
Set the linestyle(s) for the collection.
linestyle description
‘-’ or ‘solid’ solid line
‘–’ or ‘dashed’ dashed line
‘-.’ or ‘dashdot’ dash-dotted line
‘:’ or ‘dotted’ dotted line
Alternatively a dash tuple of the following form can be provided:
(offset, onoffseq),
where onoffseq is an even length tuple of on and off ink in points.
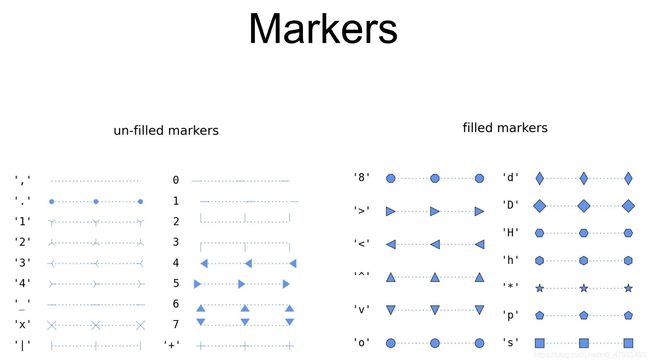
Marker(點的形狀) 的格式
- marker(點的形狀) 的種類:
https://matplotlib.org/2.0.2/api/markers_api.html#module-matplotlib.markers link
marker description
| 指令 | 點之形狀 |
|---|---|
| “.” | point |
| “,” | pixel |
| “o” | circle |
| “v” | triangle_down |
| “^” | triangle_up |
| “<” | triangle_left |
| “>” | triangle_right |
| “1” | tri_down |
| “2” | tri_up |
| “3” | tri_left |
| “4” | tri_right |
| “8” | octagon |
| “s” | square |
| “p” | pentagon |
| “P” | plus (filled) |
| “*” | star |
| “h” | hexagon1 |
| “H” | hexagon2 |
| “+” | plus |
| “x” | x |
| “X” | x (filled) |
| “D” | diamond |
| “d” | thin_diamond |
| " | " |
markers = {’.’: ‘point’, ‘,’: ‘pixel’, ‘o’: ‘circle’, ‘v’: ‘triangle_down’, ‘^’: ‘triangle_up’, ‘<’: ‘triangle_left’, ‘>’: ‘triangle_right’, ‘1’: ‘tri_down’, ‘2’: ‘tri_up’, ‘3’: ‘tri_left’, ‘4’: ‘tri_right’, ‘8’: ‘octagon’, ‘s’: ‘square’, ‘p’: ‘pentagon’, ‘’: ‘star’, ‘h’: ‘hexagon1’, ‘H’: ‘hexagon2’, ‘+’: ‘plus’, ‘x’: ‘x’, ‘D’: ‘diamond’, ‘d’: ‘thin_diamond’, ‘|’: ‘vline’, ‘_’: ‘hline’, ‘P’: ‘plus_filled’, ‘X’: ‘x_filled’, 0: ‘tickleft’, 1: ‘tickright’, 2: ‘tickup’, 3: ‘tickdown’, 4: ‘caretleft’, 5: ‘caretright’, 6: ‘caretup’, 7: ‘caretdown’, 8: ‘caretleftbase’, 9: ‘caretrightbase’, 10: ‘caretupbase’, 11: ‘caretdownbase’, ‘None’: ‘nothing’, None: ‘nothing’, ’ ': ‘nothing’, ‘’: ‘nothing’}
filled_markers = (‘o’, ‘v’, ‘^’, ‘<’, ‘>’, ‘8’, ‘s’, ‘p’, '’, ‘h’, ‘H’, ‘D’, ‘d’, ‘P’, ‘X’)
fillstyles = (‘full’, ‘left’, ‘right’, ‘bottom’, ‘top’, ‘none’)
Color(顏色) 的格式
- color 的指令與速查表
https://matplotlib.org/2.0.2/api/colors_api.html?highlight=color#module-matplotlib.colors link
顏色的指定方法
Commands which take color arguments can use several formats to specify the colors. For the basic built-in colors,
- 使用顏色單字的第一個字母** you can use a single letter
| 單字 | 顏色 |
|---|---|
| b | blue |
| g | green |
| r | red |
| c | cyan |
| m | magenta |
| y | yellow |
| k | black |
| w | white |
To use the colors that are part of the active color cycle in the current style, use C followed by a digit. For example:
C0: The first color in the cycle
C1: The second color in the cycle
-
可以使用小數 0-1 range
Gray shades can be given as a string encoding a float in the 0-1 range, e.g.:
color = ‘0.75’ -
color = ‘#eeefff’ 使用網頁的16進制
For a greater range of colors, you have two options. You can specify the color using an html hex string, as in:
color = ‘#eeefff’
(possibly specifying an alpha value as well), -
使用 RGB 格式 (r, g, b)
or you can pass an (r, g, b) or (r, g, b, a) tuple, where each of r, g, b and a are in the range [0,1]. -
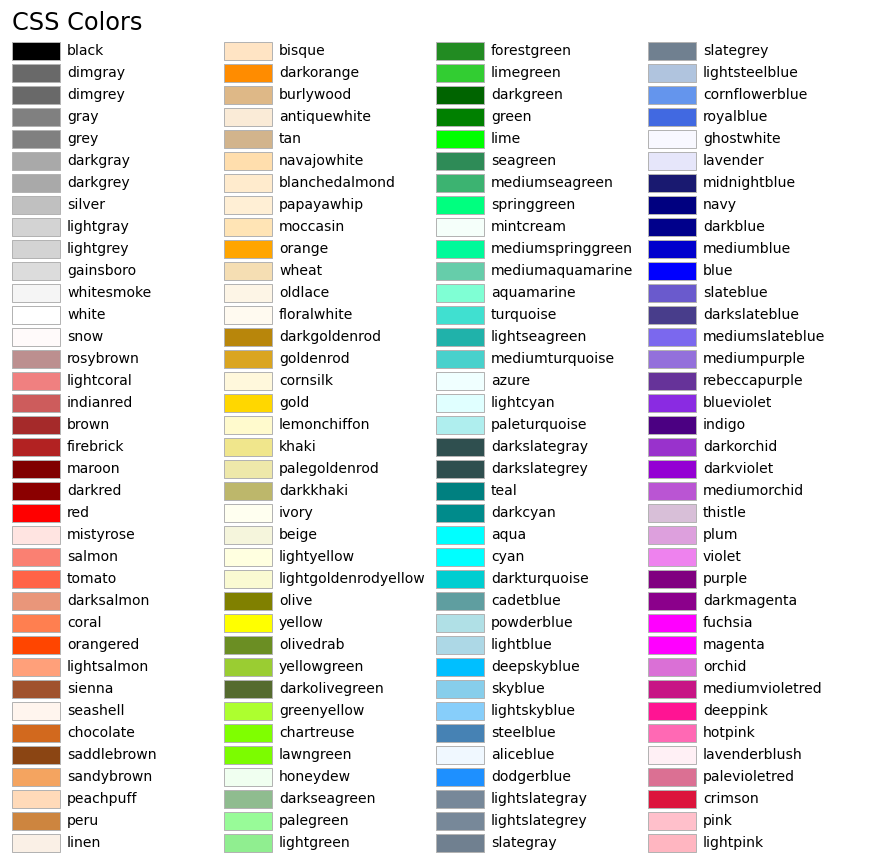
有效的網頁顏色英文名稱都可以用
Finally, legal html names for colors, like ‘red’, ‘burlywood’ and ‘chartreuse’ are supported.

Ref: 黃春林, Matplotlib使用教程, color 英文名稱.
 以上是 Tableau Colors(顏色映射表) 的 **tab10(是預設的顏色映射表)**所含有的10個最基本的顏色.
Example/Gallery/Color/Color Demo:
“9. one of {‘tab:blue’, ‘tab:orange’, ‘tab:green’, ‘tab:red’, ‘tab:purple’, ‘tab:brown’, ‘tab:pink’, ‘tab:gray’, ‘tab:olive’, ‘tab:cyan’} which are the Tableau Colors from the ‘tab10’ categorical palette (which is the default color cycle);”
Ref: Gallery/Color/Color Demo: https://matplotlib.org/stable/gallery/color/color_demo.html#sphx-glr-gallery-color-color-demo-py link
顏色之 RGB 與 16進制 與英文名稱之對照總表
 可以參考 Wiki,
 或是 R-color 那張表: Bio381那門課的網頁/Cheat Sheets & Programming Resources/Color Chart
https://gotellilab.github.io/Bio381/CheatSheets/CheatSheets.html
https://gotellilab.github.io/Bio381/CheatSheets/ColorChart.pdf link
Color Demo 講解顏色的指定方法
Example/Gallery/color/Color Demo 有講到顏色的指定方法:
Matplotlib recognizes the following formats to specify a color:
- an RGB or RGBA tuple of float values in [0, 1] (e.g. (0.1, 0.2, 0.5) or (0.1, 0.2, 0.5, 0.3)). RGBA is short for Red, Green, Blue, Alpha;
- a hex RGB or RGBA string (e.g., ‘#0F0F0F’ or ‘#0F0F0F0F’);
- a shorthand hex RGB or RGBA string, equivalent to the hex RGB or RGBA string
obtained by duplicating each character, (e.g., ‘#abc’, equivalent to ‘#aabbcc’, or ‘#abcd’, equivalent to ‘#aabbccdd’); - a string representation of a float value in [0, 1] inclusive for gray level (e.g., ‘0.5’);
- a single letter string, i.e. one of {‘b’, ‘g’, ‘r’, ‘c’, ‘m’, ‘y’, ‘k’, ‘w’}, which are short-hand notations for shades of blue, green,
red, cyan, magenta, yellow, black, and white; - a X11/CSS4 (“html”) color name, e.g. “blue”;
- a name from the xkcd color survey, prefixed with ‘xkcd:’ (e.g., ‘xkcd:sky blue’);
- a “Cn” color spec, i.e. ‘C’ followed by a number, which is an index into the default property cycle (rcParams[“axes.prop_cycle”]
(default: cycler(‘color’, [’#1f77b4’, ‘#ff7f0e’, ‘#2ca02c’, ‘#d62728’, ‘#9467bd’, ‘#8c564b’, ‘#e377c2’, ‘#7f7f7f’, ‘#bcbd22’, ‘#17becf’])));
the indexing is intended to occur at rendering time, and defaults to black if the cycle does not include color. - one of {‘tab:blue’, ‘tab:orange’, ‘tab:green’, ‘tab:red’, ‘tab:purple’, ‘tab:brown’, ‘tab:pink’, ‘tab:gray’, ‘tab:olive’, ‘tab:cyan’}
which are the Tableau Colors from the ‘tab10’ categorical palette (which is the default color cycle);
For more information on colors in matplotlib see:
- the Specifying Colors tutorial; https://matplotlib.org/stable/tutorials/colors/colors.html link
- the matplotlib.colors API; https://matplotlib.org/stable/api/colors_api.html#module-matplotlib.colors link
- the List of named colors example. https://matplotlib.org/stable/gallery/color/named_colors.html link
Ref: https://matplotlib.org/stable/gallery/color/color_demo.html#sphx-glr-gallery-color-color-demo-py link
set_linewidth, ()set_color() 等函數列表
| Property | Description |
|---|---|
| set_aa(val) | alias for set_antialiased |
| set_antialiased(b) | True if line should be drawin with antialiased rendering ACCEPTS: [True | False] |
| set_c(val) | alias for set_color |
| set_color(color) | Set the color of the line ACCEPTS: any matplotlib color |
| set_dash_capstyle(s) | Set the cap style for dashed linestyles ACCEPTS: [‘butt’ | ‘round’ | ‘projecting’] |
| set_dash_joinstyle(s) | Set the join style for dashed linestyles ACCEPTS: [‘miter’ |
| set_dashes(seq) | Set the dash sequence, sequence of dashes with on off ink in points. If seq is empty or if seq = (None, None), the linestyle will be set to solid. ACCEPTS: sequence of on/off ink in points |
| set_data(*args) | Set the x and y data ACCEPTS: 2D array (rows are x, y) or two 1D arrays |
| set_drawstyle(drawstyle) | Set the drawstyle of the plot ‘default’ connects the points with lines. The steps variants produce step-plots. ‘steps’ is equivalent to ‘steps-pre’ and is maintained for backward-compatibility. ACCEPTS:[‘default’ |
| set_fillstyle(fs) | Set the marker fill style; ‘full’ means fill the whole marker. ‘none’ means no filling; other options are for half-filled markers. ACCEPTS: [‘full’ |
| set_linestyle(ls) | Set the linestyle of the line (also accepts drawstyles, e.g., ‘steps–’) ACCEPTS: [‘solid’ | ‘dashed’, ‘dashdot’, ‘dotted’ |(offset, on-off-dash-seq) | ‘-’ | ‘–’ | ‘-.’ | ‘:’ | ‘None’ | ’ ’ | ‘’] |
| set_drawstyle() | To set the drawing style (stepping) of the plot. |
| set_linewidth(w) | Set the line width in points ACCEPTS: float value in points |
| set_ls(val) | alias for set_linestyle |
| set_lw(val) | alias for set_linewidth |
| set_marker(marker) | Set the line marker ACCEPTS: A valid marker style |
| set_markeredgecolor(ec) | Set the marker edge color ACCEPTS: any matplotlib color |
| set_markeredgewidth(ew) | Set the marker edge width in points ACCEPTS: float value in points |
| set_markerfacecolor(fc) | Set the marker face color. ACCEPTS: any matplotlib color |
| set_markerfacecoloralt(fc) | Set the alternate marker face color. ACCEPTS: any matplotlib color |
| set_markersize(sz) | Set the marker size in points ACCEPTS: float |
| set_markevery(every) | Set the markevery property to subsample the plot when using markers. e.g., if every=5, every 5-th marker will be plotted. ACCEPTS: [None |
| set_mec(val) | alias for set_markeredgecolor |
| set_mew(val) | alias for set_markeredgewidth |
| set_mfc(val) | alias for set_markerfacecolor |
| set_mfcalt(val) | alias for set_markerfacecoloralt |
| set_ms(val) | alias for set_markersize |
| set_picker§ | Sets the event picker details for the line. ACCEPTS: float distance in points or callable pick function fn(artist, event) |
| set_pickradius(d) | Sets the pick radius used for containment tests ACCEPTS: float distance in points |
| set_solid_capstyle(s) | Set the cap style for solid linestyles ACCEPTS: [‘butt’ |
| set_solid_joinstyle(s) | Set the join style for solid linestyles ACCEPTS: [‘miter’ |
| set_transform(t) | set the Transformation instance used by this artistACCEPTS: a matplotlib.transforms.Transform instance |
| set_xdata(x) | Set the data np.array for x ACCEPTS: 1D array |
| set_ydata(y) | Set the data np.array for y ACCEPTS: 1D array |
Ref: 以上, plt.plot() 2D 線的屬性表 set_color()等 可以查 matplotlib.lines.Line2D link
物件導向語法方面的指令表格
在做較個人化的操控時, 建議用物件導向的方式,
https://matplotlib.org/stable/api/#the-object-oriented-api link,
後面的閱讀指引指出: 較常用的是 matplotlib.axes, matplotlib.figure 的指令, 而 "Gallery" link 的例子多半是物件導向的.
The object-oriented API
At its core, Matplotlib is object-oriented. We recommend directly working with the objects, if you need more control and customization of your plots.
In many cases you will create a Figure and one or more Axes using pyplot.subplots and from then on only work on these objects. However, it’s also possible to create Figures explicitly (e.g. when including them in GUI applications).
Further reading:
- matplotlib.axes.Axes link
- and matplotlib.figure.Figure link for an overview of plotting functions.
- Most of the examples in
"Gallery"link use the object-oriented approach (except for the pyplot section)
Matplotlib速查表
在為點指定形狀,顏色,大小等時, 使用這些指定特殊 style 的指令時, 手邊最好隨時準備好一張速查表 cheatsheet,
ref:
-
Pjer, Matplotlib速查表——画图时候一定要放手边的表, link
-
原始出處為 Matplotlib 的 github 處:
https://link.zhihu.com/?target=https%3A//github.com/rougier/matplotlib-cheatsheet, link
Reference
-
推薦, 很棒的系列: Python-Matplotlib可视化(1)一文详解常见统计图的绘制, https://blog.csdn.net/LOVEmy134611/article/details/117301771 link
-
姜楓, 許桂秋, 大數據可視化技術, Sec 2.5, 人民郵電, 2019.
- Sec 2.5 數據可視化的基本圖表
2.5.1 原始數據繪圖
2.5.2 簡單統計值描繪
2.5.3 多視圖協調關聯
ch 3 時間數據可視化
ch 4 比例數據可視化
ch 5 關係數據可視化
ch 6 文本數據可視化
ch 7 複雜數據可視化
ch 8 交互式數據可視化
- Sec 2.5 數據可視化的基本圖表
-
Data Visualization 資料視覺化教學, Kaggle 的網頁上的教學, https://www.kaggle.com/learn/data-visualization link
-
Matplotlib30官網手冊與範例, https://matplotlib.org/2.0.2/index.html link.
-
Matplotlib30官網/Tutorials, 教學區, 分入門中階高階等, https://matplotlib.org/stable/tutorials/index.html link
-
Matplotlib30官網/Tutorials, 教學區, Usage Guide 是一整體的初步介紹,
“This tutorial covers some basic usage patterns and best-practices to help you get started with Matplotlib.”, https://matplotlib.org/stable/tutorials/index.html link -
Matplotlib 3.4.2 官網/Tutorials, 教學區, Pyplot tutorial, 專門介紹 Pyplot, https://matplotlib.org/2.0.2/users/pyplot_tutorial.html, link
-
各範例附原始碼, 3.4.2 版的, 在主頁: https://matplotlib.org/, 點選 Example, https://matplotlib.org/stable/gallery/index.html link
這裡有初階到高階的各種範例附原始碼, 初學者可以從圖形找自己要的例子, 觀摩原始碼. -
各範例附原始碼, 舊版 2.0.2 版的, 在Matplotlib官網各種例子, https://matplotlib.org/2.0.2/gallery.html link
-
Matplotlib 速查表 cheatsheet: 在使用這些指定特殊 style 的指令時, 手邊最好隨時準備好一張速查表 cheatsheet,
Pjer, Matplotlib速查表——画图时候一定要放手边的表, link -
Matplotlib 速查表 cheatsheet: 原始出處為 Matplotlib 的 github 處: https://link.zhihu.com/?target=https%3A//github.com/rougier/matplotlib-cheatsheet, link
-
Color Demo 講解顏色的指定方法
Example/Gallery/color/Color Demo 有講到顏色的指定方法, https://matplotlib.org/stable/gallery/color/color_demo.html#sphx-glr-gallery-color-color-demo-py link -
For more information on colors in matplotlib see:
- the Specifying Colors tutorial; https://matplotlib.org/stable/tutorials/colors/colors.html link
- the matplotlib.colors API; https://matplotlib.org/stable/api/colors_api.html#module-matplotlib.colors link
- the List of named colors example. https://matplotlib.org/stable/gallery/color/named_colors.html link
-
顏色之 RGB 與 16進制 與英文名稱之對照總表
可以參考 Wiki,
或是 R-color 那張表: Bio381那門課的網頁/Cheat Sheets & Programming Resources/Color Chart
https://gotellilab.github.io/Bio381/CheatSheets/CheatSheets.html
https://gotellilab.github.io/Bio381/CheatSheets/ColorChart.pdf link -
黃春林, Matplotlib 使用教程, color 英文名稱.
-
美股歷史走勢】道瓊指數歷史100年回顧, https://www.stockfeel.com.tw/%E9%81%93%E7%93%8A%E6%8C%87%E6%95%B8%E7%99%BE%E5%B9%B4%E5%A4%A7%E5%9B%9E%E9%A1%A7/ link
-
CSDN Markdown Mermaid 流程图示例, https://blog.csdn.net/qwfys200/article/details/84887665 link
