特征工程(八)特征工程案例分析(1)—面部识别
1、加载面部识别数据集
from sklearn.datasets import fetch_lfw_people
import numpy as np
from sklearn.decomposition import PCA
import matplotlib.pyplot as plt
from sklearn.model_selection import train_test_split
from sklearn.linear_model import LogisticRegression
from sklearn.model_selection import GridSearchCV
from sklearn.metrics import  confusion_matrix, accuracy_score
from sklearn.pipeline import  Pipeline
import matplotlib as mpl
# 解决中文乱码
mpl.rcParams['font.sans-serif'] = [u'SimHei']
mpl.rcParams['axes.unicode_minus'] = False


%matplotlib inline
'''
数据

'''

# 加载数据,每个人至少有70个人脸数据
lfw_people = fetch_lfw_people(min_faces_per_person=70, resize=0.4)
如果加载失败,可以参考sklearn导入人脸图片fetch_lfw_people出错如何解决?
2、数据探索
'''
探索性数据分析

'''

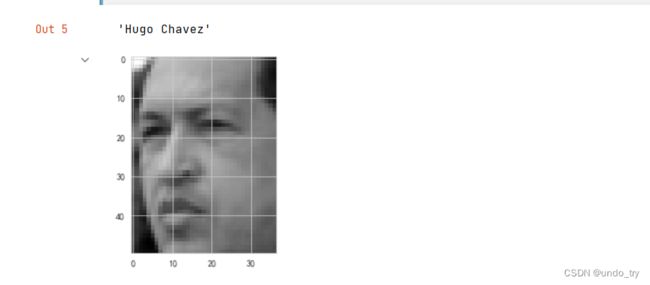
# 画出一个样本的图像
plt.imshow(X[0].reshape(50, 37), cmap=plt.cm.gray)
lfw_people.target_names[y[0]]
# 将特征缩放后,再次画出图像
from sklearn.preprocessing import StandardScaler

plt.imshow(StandardScaler().fit_transform(X)[0].reshape(50, 37), cmap=plt.cm.gray)
lfw_people.target_names[y[0]]

# 可以看见,图像略有不同,脸部周围的像素变暗了
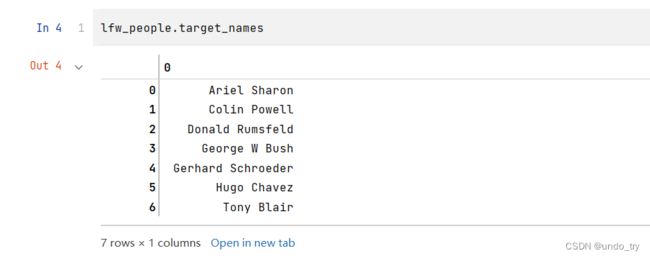
n_classes = lfw_people.target_names.shape[0]
n_samples = X.shape[0]
n_features = X.shape[1]

print('类别数目:{}'.format(n_classes))
print('样本的数目:{}'.format(n_samples))
print('特征数目:{}'.format(n_features))
3、应用面部识别
'''
应用面部识别

'''
# 将数据分割为训练集和测试集
X_train, X_test, y_train, y_test = train_test_split(X, y, test_size=0.25, random_state=1)


# 在数据集上进行主成分分析(PCA).
# PCA实例化
pca = PCA(n_components=200, whiten=True)

print("Extracting the top %d eigenfaces from %d faces" % (200, X_train.shape[0]))

# 创建流水线
pca_pipe = Pipeline([
    ('scale', StandardScaler()),
    ('pca', pca)
])

# 拟合流水线
pca_pipe.fit_transform(X_train)

# 从流水线取PCA
extracted_pca = pca_pipe.steps[1][1]
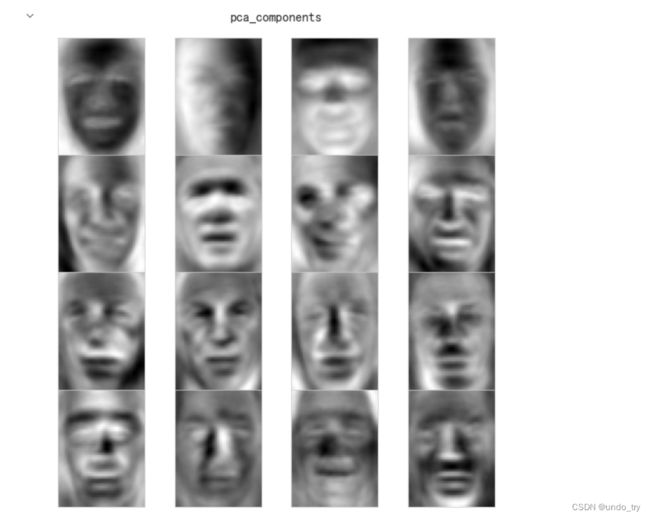
# 创建函数,绘制PCA的主成分
components = extracted_pca.components_
def plot_pca_components(images, n_col, n_row):
    plt.figure(figsize=(2.0 * n_col, 2.26 * n_row))
    plt.suptitle("pca_components", size=16)

    for i, comp in enumerate(images):
        plt.subplot(n_row, n_col, i + 1)
        plt.imshow(
            comp.reshape((50, 37)),
            cmap=plt.cm.gray,
            vmin=comp.min(),
            vmax=comp.max()
        )
        plt.xticks(())
        plt.yticks(())

    plt.subplots_adjust(0.01, 0.05, 0.99, 0.93, 0.04, 0.0)
    plt.show()

# 绘制前16个
plot_pca_components(components[:16], 4, 4)

# 可以看到每行每列的PCA主成分
# 每个主成分包括了可以区分不同人脸的重要信息
import itertools
# 绘制混淆矩阵
def plot_confusion_matrix(cm, classes,
                          normalize=False,
                          title='Confusion matrix',
                          cmap=plt.cm.Blues):
    """
    This function prints a more readable confusion matrix with heat labels and options for noramlization
    Normalization can be applied by setting `normalize=True`.
    """
    plt.imshow(cm, interpolation='nearest', cmap=cmap)
    plt.title(title)
    plt.colorbar()
    tick_marks = np.arange(len(classes))
    plt.xticks(tick_marks, classes, rotation=45)
    plt.yticks(tick_marks, classes)

    thresh = cm.max() / 2.
    for i, j in itertools.product(range(cm.shape[0]), range(cm.shape[1])):
        plt.text(j, i, cm[i, j],
                 horizontalalignment="center",
                 color="white" if cm[i, j] > thresh else "black")
    plt.ylabel('True label')
    plt.xlabel('Predicted label')
'''
不使用PCA,查看一下差异

'''

lr = LogisticRegression()

param = {
    'C':[1e-2, 1e-1, 1e0, 1e1, 1e2]
}

grid = GridSearchCV(
    lr,
    param
)

grid.fit(X_train, y_train)

best_clf = grid.best_estimator_
# 测试集进行预测
y_pred = best_clf.predict(X_test)

target_names = lfw_people.target_names

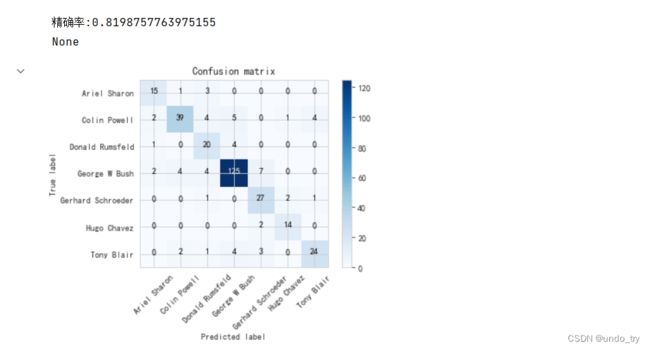
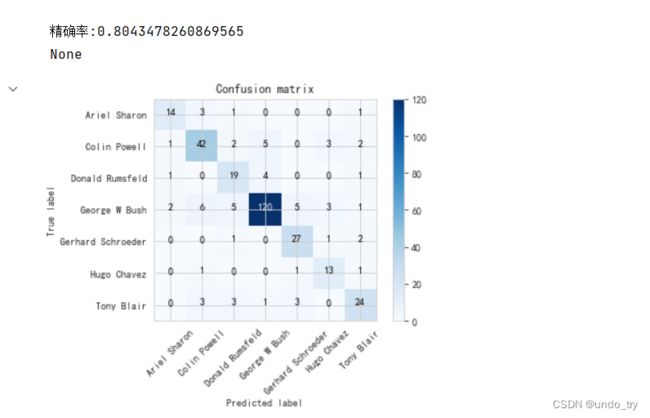
print("精确率:{}".format(accuracy_score(y_pred, y_test)))
print(
    plot_confusion_matrix(
        confusion_matrix(y_test, y_pred, labels=range(n_classes)) , target_names
    )
)
# 不使用pca达到了81.9%的准确率
'''
使用PCA,查看一下差异

'''


lr = LogisticRegression()
pca_pipe = Pipeline(
    [
        ('pca',PCA(n_components=200)),
        ('lr', lr)
    ]
)

pipe_param = {
    'lr__C':[1e-2, 1e-1, 1e0, 1e1, 1e2]
}

grid = GridSearchCV(
    pca_pipe,
    pipe_param
)

grid.fit(X_train, y_train)

best_clf = grid.best_estimator_
# 测试集进行预测
y_pred = best_clf.predict(X_test)

target_names = lfw_people.target_names

print("精确率:{}".format(accuracy_score(y_pred, y_test)))
print(
    plot_confusion_matrix(
        confusion_matrix(y_test, y_pred, labels=range(n_classes)) , target_names
    )
)
# 可以看到准确率下降了
'''
做一个网格搜索,寻找最佳模型和准确率
'''
def get_best_model_and_accuracy(model, params, X, y):

    grid = GridSearchCV(model, # 要搜索的模型
                        params, # 要尝试的参数
                        error_score=0.0 # 如果报错,结果为0
                        )

    # 拟合模型和参数
    grid.fit(X, y)
    # 经典的性能指标
    print('最佳的准确率为:{}'.format(grid.best_score_))
    # 得到最佳准确率的最佳参数
    print('得到最佳准确率的最佳参数:{}'.format(grid.best_params_))
    # 拟合的平均时间
    print('拟合的平均时间:{} 秒'.format(round(grid.cv_results_['mean_fit_time'].mean(), 3)))
    # 预测的平均时间
    print('预测的平均时间:{} 秒'.format(round(grid.cv_results_['mean_score_time'].mean(), 3)))

# 创建网格流水线
face_params = {'lr__C':[1e-2, 1e-1, 1e0, 1e1, 1e2],
               'preprocessing__pca__n_components':[100, 150, 200, 250, 300],
               'preprocessing__pca__whiten':[True, False],
               'preprocessing__lda__n_components':range(1, 7)
               # [1, 2, 3, 4, 5, 6] recall the max allowed is n_classes-1
              }

from sklearn.discriminant_analysis import  LinearDiscriminantAnalysis

pca = PCA()
lda = LinearDiscriminantAnalysis()
preprocessing = Pipeline([
    ('scale', StandardScaler()),
    ('pca', pca),
    ('lda', lda)
])

face_pipeline = Pipeline(
    [
        ('preprocessing', preprocessing),
        ('lr', LogisticRegression())
    ]
)

get_best_model_and_accuracy(face_pipeline, face_params, X, y)

# 可以看到准确率提高了,而且预测速度很快

