Python实战HSV颜色模型——提取像素点并判断像素点颜色
首先参考以下博文将图片读取为RGB矩阵
https://blog.csdn.net/u012421101/article/details/116798509
之后将RGB转为HSV
def rgb2hsv(r, g, b):
    r, g, b = r/255.0, g/255.0, b/255.0
    mx = max(r, g, b)
    mn = min(r, g, b)
    m = mx-mn
    if mx == mn:
        h = 0
    elif mx == r:
        if g >= b:
            h = ((g-b)/m)*60
        else:
            h = ((g-b)/m)*60 + 360
    elif mx == g:
        h = ((b-r)/m)*60 + 120
    elif mx == b:
        h = ((r-g)/m)*60 + 240
    if mx == 0:
        s = 0
    else:
        s = m/mx
    v = mx
    H = h / 2
    S = s * 255.0
    V = v * 255.0
    return H, S, V
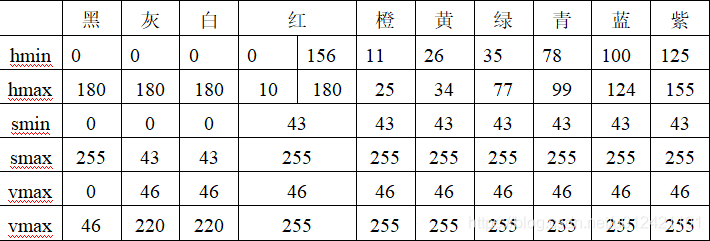
设定颜色判断公式(此处仅判断黄色和绿色)
def yellow(H, S, V):
    if(H>=26 and H<=34 and S>=43 and S<=255 and V>=46 and V<=255):
        return True

def green(H, S, V):
    if(H>=35 and H<=77 and S>=43 and S<=255 and V>=46 and V<=255):
        return True
提取像素点代码
from typing import Sized
from PIL import Image
import numpy as np
import matplotlib.pyplot as plt
import math
import random
import time

plt.rcParams['font.sans-serif']=['SimHei'] #显示中文标签
plt.rcParams['axes.unicode_minus']=False   #这两行需要手动设置

'''
	首先读取图片的RGB特征值,读取结果为三维矩阵形式
'''
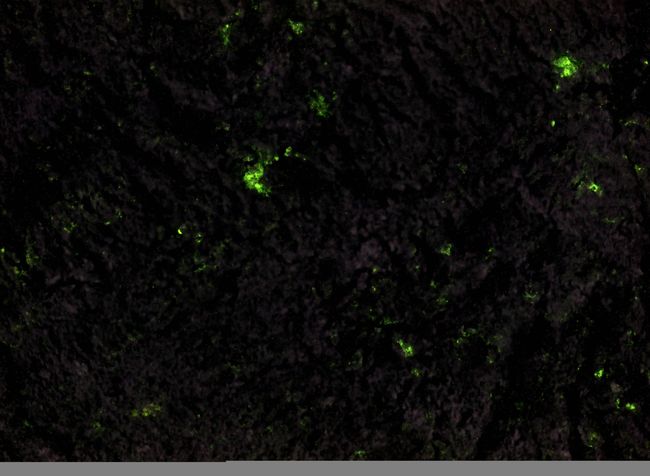
L_path='train/B/Rock/4-2.jpg'
L_image=Image.open(L_path)
out = L_image.convert("RGB")
dataset=np.array(out)

'''
	绘制原始图片
'''
fig = plt.figure()
ax = fig.add_subplot(1,2,1)
plt.imshow(dataset)
ax.set_title("原始图")

size = dataset.shape
print(size)
count = 0

'''
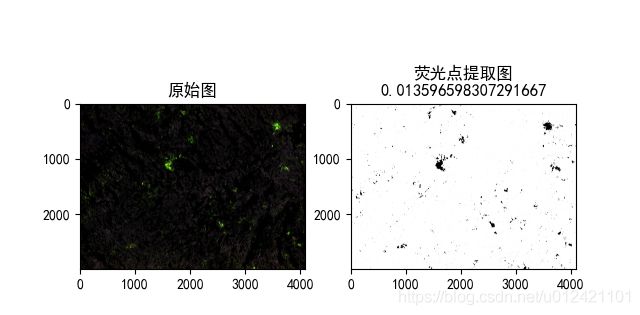
	黄色与绿色荧光点将会设置为黑色
	其它颜色设置白色
'''
for i in range(size[0]):
    for j in range(size[1]):
        temp0,temp1,temp2 = rgb2hsv(dataset[i,j,0],dataset[i,j,1],dataset[i,j,2])#颜色转化
        if(green(temp0,temp1,temp2)):
            #设置为黑色
            count = count + 1
            dataset[i,j,0] = 0
            dataset[i,j,1] = 0
            dataset[i,j,2] = 0
        elif (yellow(temp0,temp1,temp2)):#判定为黄色
            count = count + 1
            dataset[i,j,0] = 0
            dataset[i,j,1] = 0
            dataset[i,j,2] = 0
        else:
            dataset[i,j,0] = 255
            dataset[i,j,1] = 255
            dataset[i,j,2] = 255

print(count)

'''
	绘制提取图
'''
ax = fig.add_subplot(1,2,2)
plt.imshow(dataset)
string = str(count/(size[0]*size[1]))
ax.set_title("荧光点提取图\n"+string)
plt.show()


