matlab离群值算法
In statistics, an outlier is an observation point that is distant from other observations.
在统计中,离群点是与其他观测值相距较远的观测点。
These extreme values need not necessarily impact the model performance or accuracy, but when they do they are called “Influential” points.
这些极端值不一定会影响模型的性能或准确性,但是当它们达到极限时,它们被称为“影响力”点。
Note: An outlier is a data point that diverges from an overall pattern in a sample. An influential point is any point that has a large effect on the slope of a regression line.
注意:异常值的数据点从一个样品中的整体图案发散。 有影响力的一点是,对回归直线的斜率有很大影响的任何点。
Now the question arises that how we can detect these outliers and how to handle them?
现在的问题是,我们如何检测这些异常值以及如何处理它们?
Well before jumping straight into the solution lets explore that how the outliers being added to our dataset. What is the root cause of it.
在直接进入解决方案之前,我们先探讨一下如何将异常值添加到我们的数据集中。 根本原因是什么?
数据集异常值的最常见原因: (Most common causes of outliers on a data set:)
- Data entry errors (human errors) 数据输入错误(人为错误)
- Measurement errors (instrument errors) 测量误差(仪器误差)
- Experimental errors (data extraction or experiment planning/executing errors) 实验错误(数据提取或实验计划/执行错误)
- Intentional (dummy outliers made to test detection methods) 有意的(虚假异常值用于检测检测方法)
- Data processing errors (data manipulation or data set unintended mutations) 数据处理错误(数据处理或数据集意外突变)
- Sampling errors (extracting or mixing data from wrong or various sources) 采样错误(从错误或各种来源提取或混合数据)
- Natural (not an error, novelties in data) 自然(不是错误,数据新颖)
检测异常值的常用方法 (Common Methods for Detecting Outliers)
There are multiple methods to identify outliers in the dataset
有多种方法可以识别数据集中的异常值
Box plot
箱形图
Scatter plot
散点图
Z-score method
Z得分法
IQR score
IQR分数
箱形图(Box-Plot)
In descriptive statistics, a box plot is a method for graphically depicting groups of numerical data through their quartiles. Box plots may also have lines extending vertically from the boxes (whiskers) indicating variability outside the upper and lower quartiles, hence the terms box-and-whisker plot and box-and-whisker diagram. Outliers may be plotted as individual points.
在描述性统计中,箱形图是一种通过四分位数以图形方式描绘数字数据组的方法。 盒形图还可以具有线从所述箱(晶须)垂直延伸的指示 上下四分位之外的可变性,因此称为“箱须图”和“箱须图”。 离群值可以绘制为单个点。

The quickest and easiest way to identify outliers is by visualizing them using plots. If your dataset is not huge (approx. up to 10k observations & 100 features), I would highly recommend you build scatter plots & box-plots of variables. If there aren’t outliers, you’ll definitely gain some other insights like correlations, variability, or external factors like the impact of world war/recession on economic factors. However, this method is not recommended for high dimensional data where the power of visualization fails.
识别异常值的最快,最简单的方法是使用绘图将其可视化。 如果您的数据集不是很大(约有1万个观测值和100个要素),我强烈建议您构建散点图和变量的箱形图。 如果没有异常值,您肯定会获得其他一些见解,例如相关性,可变性或外部因素,例如世界大战/经济衰退对经济因素的影响。 但是,不建议将这种方法用于可视化功能失效的高维数据。
The box plot uses inter-quartile range to detect outliers. Here, we first determine the quartiles Q1 and Q3.
箱形图使用四分位间距来检测离群值。 在这里,我们首先确定四分位数Q 1和Q 3。
Interquartile range is given by, IQR = Q3 — Q1
四分位数范围由下式给出:IQR = Q3-Q1
Upper limit = Q3+1.5*IQR
上限= Q3 + 1.5 * IQR
Lower limit = Q1–1.5*IQR
下限= Q1-1.5 * IQR
Anything below the lower limit and above the upper limit is considered an outlier.
低于下限和高于上限的任何值都被视为异常值。
散点图 (Scatter plot)
A scatter plot , is a type of plot or mathematical diagram using Cartesian coordinates to display values for typically two variables for a set of data. The data are displayed as a collection of points, each having the value of one variable determining the position on the horizontal axis and the value of the other variable determining the position on the vertical axis.
散点图,是一种类型的曲线图,或者使用笛卡尔坐标来对一组数据的显示通常是两个变量的值的数学图中。 数据被显示为点的集合,确定在水平轴上的位置,而另一个的值的一个变量的每一个具有的值 确定垂直轴上位置的变量。
As the definition suggests, the scatter plot is the collection of points that shows values for two variables. We can try and draw scatter plot for two variables from our dataset.
顾名思义,散点图是显示两个变量值的点的集合。 我们可以尝试从数据集中绘制两个变量的散点图。

Looking at the plot above, we can most of data points are lying bottom left side but there are points which are far from the population like top right corner.
从上图可以看出,大多数数据点都位于左下角,但有些点像右上角那样远离总体。
Z分数 (Z-score)
The Z-score is the signed number of standard deviations by which the value of an observation or data point is above the mean value of what is being observed or measured.
Z分数是符号数标准偏差,通过该观察或数据点的值是上述的被观察或测量什么的平均值。
This method assumes that the variable has a Gaussian distribution. It represents the number of standard deviations an observation is away from the mean:
此方法假定变量具有高斯分布。 它表示观察值偏离均值的标准偏差的数量:
Here, we normally define outliers as points whose modulus of z-score is greater than a threshold value. This threshold value is usually greater than 2 (3 is a common value).
在这里,我们通常将离群值定义为z分数模量大于阈值的点。 该阈值通常大于2(3是一个公共值)。

The intuition behind Z-score is to describe any data point by finding their relationship with the Standard Deviation and Mean of the group of data points. Z-score is finding the distribution of data where mean is 0 and standard deviation is 1 i.e. normal distribution.
Z分数背后的直觉是通过找到任何数据点与标准偏差和数据点组的平均值之间的关系来描述它们。 Z分数正在寻找平均值为0且标准差为1的数据分布,即正态分布。
You must be wondering that, how does this help in identifying the outliers? Well, while calculating the Z-score we re-scale and center the data and look for data points which are too far from zero. These data points which are way too far from zero will be treated as the outliers. In most of the cases a threshold of 3 or -3 is used i.e if the Z-score value is greater than or less than 3 or -3 respectively, that data point will be identified as outliers.
您一定想知道,这对识别异常值有何帮助? 好了,在计算Z分数时,我们重新缩放数据并居中,并寻找距离零太远的数据点。 这些距离零太远的数据点将被视为离群值。 在大多数情况下,使用3或-3阈值,即,如果Z分数分别大于或小于3或-3,则该数据点将被识别为异常值。
We will use Z-score function defined in scipy library to detect the outliers.
我们将使用scipy库中定义的Z评分功能来检测异常值。

Don’t be confused by the results. The first array contains the list of row numbers and second array respective column numbers, which mean z[55][1] have a Z-score higher than 3.
不要对结果感到困惑。 第一个数组包含行号列表,第二个数组分别包含列号,这意味着z [55] [1]的Z分数高于3。
IQR分数 (IQR score)
The “interquartile range”, abbreviated “IQR”, is just the width of the box in the box-and-whisker plot. That is, IQR = Q3 — Q1 . The IQR can be used as a measure of how spread-out the values are.
“四分位数范围”(缩写为“ IQR”)只是箱须图中的框的宽度。 即,IQR = Q3-Q1。 IQR可以用作衡量这些值分布程度的指标。
Statistics assumes that your values are clustered around some central value. The IQR tells how spread out the “middle” values are; it can also be used to tell when some of the other values are “too far” from the central value. These “too far away” points are called “outliers”, because they “lie outside” the range in which we expect them.
统计数据假设您的值围绕某个中心值聚集。 IQR告诉您“中间”值的分布程度。 它也可以用来指示其他一些值何时与中心值“相距太远”。 这些“太远”的点称为“离群值”,因为它们“在”我们期望的范围之外。
The IQR is the length of the box in your box-and-whisker plot. An outlier is any value that lies more than one and a half times the length of the box from either end of the box.
IQR是箱须图中的框的长度。 离群值是从框的两端到框长度的一半以上的任何值。
That is, if a data point is below Q1–1.5×IQR or above Q3 + 1.5×IQR, it is viewed as being too far from the central values to be reasonable.
也就是说,如果数据点低于Q1-1.5×IQR或高于Q3 + 1.5×IQR,则认为该数据点与中心值相距太远以至于不合理。
Code in python to calculate IQR score.
用python代码计算IQR得分。


更正,删除异常值 (Correcting, removing the Outliers)
Z-Score
Z分数
In the previous section, we saw how one can detect the outlier using Z-score but now we want to remove or filter the outliers and get the clean data. This can be done with just one line code as we have already calculated the Z-score.
在上一节中,我们看到了如何使用Z分数来检测离群值,但是现在我们要删除或过滤离群值并获取干净的数据。 由于我们已经计算了Z分数,因此仅用一个行代码即可完成。

IQR Score -
IQR分数-
Just like Z-score we can use previously calculated IQR score to filter out the outliers by keeping only valid values.
就像Z分数一样,我们可以使用先前计算的IQR分数通过仅保留有效值来过滤异常值。

对离群值敏感的算法 (Algorithms that are sentitive to outliers)
Linear Regression
线性回归

Outliers has a dramatic impact on linear regression. It can change the model equation completely i.e bad prediction or estimation. Above we can see that the value of r have been changed with the addition of the outliers.
离群值对线性回归有巨大影响。 它可以完全改变模型方程,即不良的预测或估计。 从上面我们可以看到,r的值随着离群值的增加而改变。
Logistic Regression
逻辑回归

Logistic regression is affected by the outliers as we can see in the diagram above.
如上图所示,逻辑回归受异常值的影响。
SVM
支持向量机

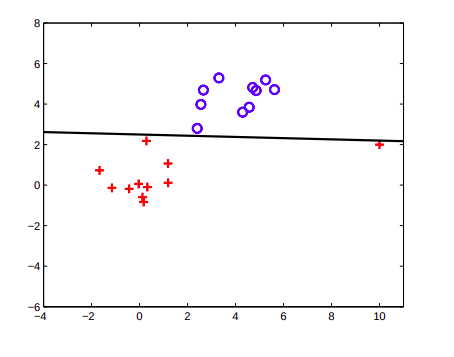
SVM is not very robust to outliers. Presence of a few outliers can lead to very bad global misclassification.
SVM对于异常值不是很可靠。 少数异常值的存在会导致非常严重的全局错误分类。
K-Nearest Neighbours (KNN)
K最近邻居(KNN)
Algorithm is sensitive to outliers, since a single mislabeled example dramatically changes the class boundaries. Anomalies affect the method significantly, because k-NN gets all the information from the input, rather than from an algorithm that tries to generalize data.
算法对异常值很敏感,因为单个错误标记的示例会极大地改变类的边界。 异常会严重影响该方法,因为k-NN从输入中获取所有信息,而不是从试图归纳数据的算法中获取所有信息。
Proposal: Avoid very small number of neighbors (k=1, for example), especially if you are in front of noisy data, so always.
建议:避免使用非常少的邻居(例如,k = 1),尤其是当您面对嘈杂的数据时,因此请务必如此。
Naive Bayes
朴素贝叶斯
Yes outlier affect naive bayes. If a word that comes in testing data that has not been seen in training leads to zero probability of that particular word in the particular class. And we know in naive bayes we multiply probability of words lying in that particular class and results zero..that leads to wrong result.
是的,异常值会影响朴素的贝叶斯。 如果测试数据中没有出现训练中出现的单词导致该特定单词在特定类别中的概率为零。 而且我们知道在朴素的贝叶斯中,我们乘以该特定类别中的单词的概率,结果为零。
Decision Tree
决策树
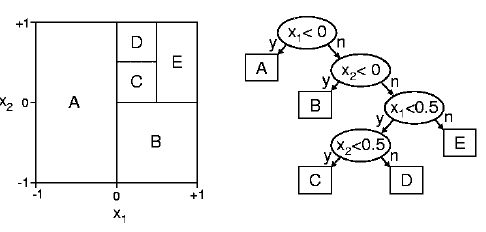
Decision tree are robust to Outliers trees divide items by lines, so it does not difference how far is a point from lines.
决策树对异常值树具有鲁棒性,离群树按行划分项目,因此与点距行的距离没有区别。
Random Forest
随机森林
Random forest handles outliers by essentially binning them.
随机森林通过本质上对它们进行分类来处理离群值。
K-Means
K均值
The k-means algorithm updates the cluster centers by taking the average of all the data points that are closer to each cluster center. When all the points are packed nicely together, the average makes sense. However, when you have outliers, this can affect the average calculation of the whole cluster. As a result, this will push your cluster center closer to the outlier.
k均值算法通过获取更接近每个聚类中心的所有数据点的平均值来更新聚类中心。 当所有要点很好地组合在一起时,平均值才有意义。 但是,当您有异常值时,这可能会影响整个群集的平均计算。 结果,这将使群集中心更靠近异常值。
Example
例
The mean of 2,2,2,3,3,3,4,4,42,2,2,3,3,3,4,4,4 is 33
2,2,2,3,3,3,4,4,42,2,2,3,3,3,4,4,4的平均值是33
If we add a single 2323 to that, the mean becomes 55, which is larger than any of the other values.
如果我们向其添加单个2323,则平均值将变为55,该平均值大于其他任何值。
Since in k-means, you’ll be taking the mean a lot, you wind up with a lot of outlier-sensitive calculations.
由于使用k均值,您将采用大量均值,因此您将获得大量离群值敏感的计算。
That’s why we have the k-medians algorithm. It just uses the median rather than the mean and is less sensitive to outliers.
这就是为什么我们有k中值算法。 它仅使用中位数而不是均值,并且对异常值不敏感。
Yet there are many ways to detect and correct the outliers but I covered the basic and important techniques once.
但是,有很多方法可以检测和纠正异常值,但是我曾经介绍过基本和重要的技术。
Happy reading :)
快乐阅读:)
https://towardsdatascience.com/ways-to-detect-and-remove-the-outliers-404d16608dba
https://towardsdatascience.com/ways-to-detect-and-remove-the-outliers-404d16608dba
https://heartbeat.fritz.ai/how-to-make-your-machine-learning-models-robust-to-outliers-44d404067d07#:~:text=What%20do%20we%20mean%20by,are%20called%20%E2%80%9CInfluential%E2%80%9D%20points.
https://heartbeat.fritz.ai/how-to-make-your-machine-learning-models-robust-to-outliers-44d404067d07#:~:text=What%20do%20we%20mean%20by,%20 %20%E2%80%9C有影响力的%E2%80%9D%20分。
https://towardsdatascience.com/a-brief-overview-of-outlier-detection-techniques-1e0b2c19e561
https://towardsdatascience.com/a-brief-overview-of-outlier-detection-techniques-1e0b2c19e561
翻译自: https://medium.com/analytics-vidhya/what-is-an-outliers-how-to-detect-and-remove-them-which-algorithm-are-sensitive-towards-outliers-2d501993d59
matlab离群值算法