Qcustomplot的简单应用(静态图,动态图)和波形绘制
QTQcustomplot的简单应用,波形绘制
QcustomPlot 库介绍
QCustomPlot是基于Qt的画图和数据可视化的C++控件。相比于Qchart、Qwt、QCustomPlot可实现较好动态刷新特性,同时安装比较简单。
QCustomPlot库的安装与导入
从官网中下载QCustomPlot的安装包。将其添加至项目的文件夹中

在项目中直接添加对应的文件

初始工作
将主程序的.h文件添加对QCustomPlot.h文件的引用,添加QCustomPlot的引用
#include 同时,需要在.pro的工程文件重添加QT += printsupport,若不添加,则会使QCustomPlot的编译出错
QT       += core gui
QT  +=  printsupport
主界面初始化
添加布局对象和QCustomPlot对象
Widget::Widget(QWidget *parent)
    : QWidget(parent)
    , ui(new Ui::Widget)
{
    ui->setupUi(this);

    layout=new QVBoxLayout(this);
    customPlot=new QCustomPlot(this);
    customPlot->resize(500,700);
    layout->addWidget(customPlot);
    this->setLayout(layout);
}
其执行的结果,如下图所示,可以明显看到,打印出来坐标轴和网格线

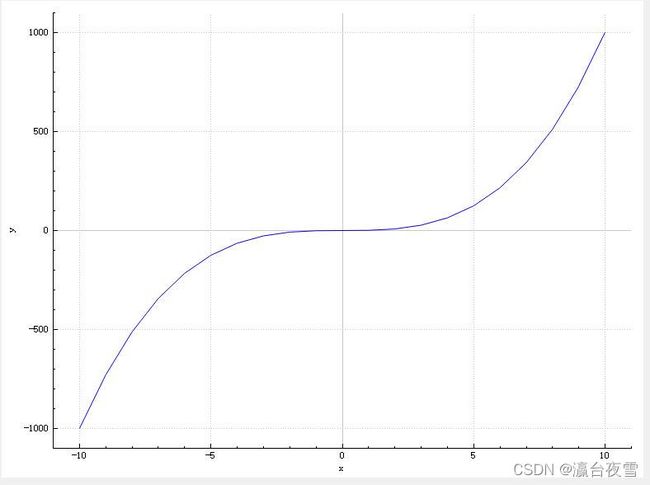
QCustomPlot 简单应用——1.绘制静态函数曲线
void Widget::drawStatic()
{
    QVector<double>x(101),y(101);
    for(int i=0;i<101;i++)
    {
        x[i]=i/5-10;
        y[i]=x[i]*x[i]*x[i];
    }
    //addGraph 添加图层
    //其数据格式需要为vector类型
    customPlot->addGraph();
    customPlot->graph(0)->setData(x,y);

    customPlot->xAxis->setLabel("x");
    customPlot->yAxis->setLabel("y");

    customPlot->xAxis->setRange(-11,11);
    customPlot->yAxis->setRange(-1100,1100);
}
QCustomPlot 简单应用——2.绘制较为复杂的静态曲线
void Widget::drawComplexStatic()
{
    customPlot->addGraph();
    //设置线条的颜色和线条的覆盖范围的颜色
    customPlot->graph(0)->setPen(QPen(Qt::blue));
    customPlot->graph(0)->setBrush(QBrush(QColor(0, 0, 255, 20)));

    customPlot->addGraph();
    customPlot->graph(1)->setPen(QPen(Qt::red));

    //输入数据的样式;
    QVector<double> x(251), y0(251), y1(251);
    for (int i=0; i<251; ++i)
    {
      x[i] = i;
      y0[i] = qExp(-i/150.0)*qCos(i/10.0); // exponentially decaying cosine
      y1[i] = qExp(-i/150.0);              // exponential envelope
    }

    //设置坐标轴的样式
    customPlot->xAxis2->setVisible(true);
    customPlot->xAxis2->setTickLabels(false);
    customPlot->yAxis2->setVisible(true);
    customPlot->yAxis2->setTickLabels(false);
    // 设置上下轴同步
    connect(customPlot->xAxis, SIGNAL(rangeChanged(QCPRange)), customPlot->xAxis2, SLOT(setRange(QCPRange)));
    connect(customPlot->yAxis, SIGNAL(rangeChanged(QCPRange)), customPlot->yAxis2, SLOT(setRange(QCPRange)));

    customPlot->graph(0)->setData(x, y0);
    customPlot->graph(1)->setData(x, y1);
    customPlot->graph(0)->rescaleAxes();
    customPlot->graph(1)->rescaleAxes(true);

    //设置对于图形的操作比如放大放小,移动
    customPlot->setInteractions(QCP::iRangeDrag | QCP::iRangeZoom | QCP::iSelectPlottables);

}

QCustomPlot 简单应用——3.绘制按键与波形联动
#include "ui_widget.h"

Widget::Widget(QWidget *parent)
    : QWidget(parent)
    , ui(new Ui::Widget)
{
    ui->setupUi(this);

    layout=new QVBoxLayout(this);
    customPlot=new QCustomPlot(this);
    customPlot->resize(500,700);

    btnClick=new QPushButton;
    btnClick->setText("点击");
//    //drawStatic();
//    drawComplexStatic();
    drawClicked();

    connect(btnClick,&QPushButton::clicked,[=]()
    {
        arrx.append(arrx.count());
        arry.append(qrand()%4096);
        customPlot->graph(0)->setData(arrx,arry);
        customPlot->replot();
        customPlot->setInteractions(QCP::iRangeDrag | QCP::iRangeZoom | QCP::iSelectPlottables);

    });
    layout->addWidget(customPlot);
    layout->addWidget(btnClick);

    this->setLayout(layout);
}

void Widget::drawClicked()
{
    customPlot->addGraph();
    customPlot->graph(0)->setPen(QPen(Qt::blue));
    //设置画刷,曲线和X轴围成面积的颜色
    customPlot->graph(0)->setBrush(QBrush(QColor(255,255,0)));
    //设置右上角图形标注名称
    customPlot->graph(0)->setName("曲线");
    customPlot->xAxis->setLabel("X");
    customPlot->yAxis->setLabel("Y");
    //设置坐标轴显示范围
    customPlot->xAxis->setRange(0,60);
    customPlot->yAxis->setRange(0,5000);
}
QCustomPlot 简单应用——4.绘制随时间变化的动态波形
这个例程主要模仿QcustomPlot官网给出的
void Widget::drawDynamic()
{
    customPlot->setInteractions(QCP::iRangeDrag|QCP::iRangeZoom
     |QCP::iSelectAxes|QCP::iSelectLegend|QCP::iSelectPlottables);

    //坐标轴
    customPlot->addGraph();
    customPlot->graph(0)->setPen(QPen(QColor(40,110,225)));
    QSharedPointer<QCPAxisTickerTime>timeTicker(new QCPAxisTickerTime);
    timeTicker->setTimeFormat("%h:%m:%s");
    customPlot->xAxis->setTicker(timeTicker);
    customPlot->axisRect()->setupFullAxesBox();
    customPlot->yAxis->setRange(-1.2,1.2);

    //让坐标轴动态的变化
    connect(customPlot->xAxis,SIGNAL(rangeChanged(QCPRange)),
            customPlot->xAxis2,SLOT(setRange(QCPRange)));
    connect(customPlot->yAxis,SIGNAL(rangeChanged(QCPRange)),
            customPlot->yAxis2,SLOT(setRange(QCPRange)));

    QTimer *dataTimer=new QTimer();
    connect(dataTimer,SIGNAL(timeout()),this,SLOT(realTimeDataSlot()));
    dataTimer->start(0);
}

void Widget::realTimeDataSlot()
{
    static QTime time(QTime::currentTime());
    double key=time.elapsed()/1000;
    static double lastPointKey=0;
    if(key-lastPointKey>0.002)
    {
        customPlot->graph(0)->addData(key,qSin(key+qrand()/(double)RAND_MAX*1*qSin(key/0.3843)));
        customPlot->graph(0)->rescaleValueAxis();
        lastPointKey=key;
    }
    customPlot->xAxis->setRange(key,8,Qt::AlignRight);
    customPlot->replot();
}