论文阅读《YOLO3D: End-to-end real-time 3D Oriented Object Bounding Box Detection from LiDAR Point Cloud》
论文地址:https://arxiv.org/abs/1808.02350v1
目录
- Abstract
- 1 Introduction
- 2 Related Work
-
- 2.1 3D Object Detection
- 2.2 Orientation Prediction
- 2.3 Real Time Performance
- 3 Approach
-
- 3.1 Point Cloud Representation
- 3.2 Yaw Angle Regression 偏航角回归
- 3.3 3D Bounding Box Regression
- 3.4 Anchors Calculation
- 3.5 Combined Loss for 3D OBB
- 4 Experiments and Results
-
- 4.1 Network Architecture and Hyper Parameters
- 4.2 Dataset and Preprocessing
- 4.3 Training
- 4.4 KITTI Results and Error Analysis
- 4.5 Effect of Grid Map Resolution
- 5 Conclusions
Abstract
Object detection and classification in 3D is a key task in Automated Driving (AD). LiDAR sensors are employed to provide the 3D point cloud reconstruction of the surrounding environment, while the task of 3D object bounding box detection in real time remains a strong algorithmic challenge. In this paper, we build on the success of the oneshot regression meta-architecture in the 2D perspective image space and extend it to generate oriented 3D object bounding boxes from LiDAR point cloud.Our main contribution is in extending the loss function of YOLO v2 to include the yaw angle, the 3D box center in Cartesian coordinates and the height of the box as a direct regression problem. This formulation enables real-time performance, which is essential for automated driving. Our results are showing promising figures on KITTI benchmark, achieving real-time performance (40 fps) on Titan X GPU.
3D 中的对象检测和分类是自动驾驶 (AD) 中的一项关键任务。 LiDAR 传感器用于提供周围环境的 3D 点云重建,而实时 3D 对象边界框检测的任务仍然是一个强大的算法挑战。 在本文中,我们以 2D 透视图像空间中 oneshot 回归元架构的成功为基础,并将其扩展为从 LiDAR 点云生成定向 3D 对象边界框。 我们的主要贡献是将 YOLO v2 的损失函数扩展到包括偏航角、笛卡尔坐标中的 3D 框中心和框的高度作为直接回归问题。 该公式可实现实时性能,这对于自动驾驶至关重要。 我们的结果在 KITTI 基准测试中显示出有希望的数据,在 Titan X GPU 上实现了实时性能 (40 fps)。
1 Introduction
Automated Driving (AD) success is highly dependent on efficient environment perception. Sensors technology is an enabler to environment perception. LiDAR-based environment perception systems are essential components for homogeneous (same sensor type) or heterogeneous (different sensors types) fusion systems. The key feature of LiDAR is its physical ability to perceive depth at high accuracy.
自动驾驶 (AD) 的成功高度依赖于高效的环境感知。 传感器技术是环境感知的推动者。 基于 LiDAR 的环境感知系统是同质(相同传感器类型)或异构(不同传感器类型)融合系统的重要组成部分。 LiDAR 的主要特征是其高精度感知深度的物理能力。
Among the most important tasks of the environment perception is Object Bounding Box (OBB) detection and classification, which may be done in the 2D (bird-view) or the 3D space. Unlike camera-based systems, LiDAR point clouds are lacking some features that exist in camera RGB perspective scenes, like colors. This makes the classification task from LiDAR only more complicated. On the other hand, depth is given as a natural measurement by LiDAR, which enables 3D OBB detections. The density of the LiDAR point cloud plays a vital role in the efficient classification of the object type, especially small objects like pedestrians and animals.
环境感知的最重要任务之一是物体边界框 (OBB) 检测和分类,这可以在 2D(鸟瞰图)或 3D 空间中完成。 与基于相机的系统不同,LiDAR 点云缺少相机 RGB 透视场景中存在的一些特征,例如颜色。 这使得 LiDAR 的分类任务更加复杂。 另一方面,深度是由 LiDAR 提供的自然测量值,可实现 3D OBB 检测。 LiDAR 点云的密度在物体类型的有效分类中起着至关重要的作用,尤其是像行人和动物这样的小物体。
Real-time performance is essential in AD systems. While Deep Learning (DL) has a well-known success story in camera-based computer vision, such approaches suffer high latency in their inference path, due to the expensive convolution operations. In the context of object detection, rich literature exists that tackles the problem of real-time performance. Single shot detectors, like YOLO[1] and SSD [2] are some of the best in this regard.
实时性能在 AD 系统中至关重要。 虽然深度学习 (DL) 在基于相机的计算机视觉方面有着众所周知的成功案例,但由于昂贵的卷积运算,此类方法在推理过程中存在高延迟。 在对象检测的背景下,存在解决实时性能问题的丰富文献。 单次检测器,如 YOLO[1] 和 SSD [2] 在这方面是最好的。
In this paper, we extend YOLO V2[3] to perform 3D OBB detection and classification from 3D LiDAR point cloud (PCL). In the input phase, we feed the bird-view of the 3D PCL to the input convolution channels. The network architecture follows the meta-architecture of YOLO with architecture adaptation and tuning to match the nature of the sparse LiDAR input. The predictions include 8 regression outputs + classes (versus 5 regressors + classes in case of YOLO V2): the OBB center in 3D (x, y, z), the 3D dimensions (length, width and height), the orientation in the bird-view space, the confidence, and the object class label. Following the one-shot regression theme, we do not depend on any region proposal pipelines, instead, the whole system is trained end to end.
在本文中,我们扩展了 YOLO V2[3] 以从 3D LiDAR 点云 (PCL) 执行 3D OBB 检测和分类。 在输入阶段,我们将 3D PCL 的鸟瞰图提供给输入卷积通道。 网络架构遵循 YOLO 的元架构,具有架构适应和调整以匹配稀疏 LiDAR 输入的性质。 预测包括 8 个回归输出 + 类(在 YOLO V2 的情况下为 5 个回归输出 + 类):3D 中的 OBB 中心(x、y、z)、3D 尺寸(长度、宽度和高度)、鸟瞰空间的方向、置信度和对象类标签。 遵循一次性回归主题,我们不依赖于任何区域提议管道,而是对整个系统进行端到端的训练。
The main contributions of this work can be summarized as follows:
这项工作的主要贡献可以总结如下:
1- Extending YOLO V2[3] to include orientation of the OBB as a direct regression task.
2- Extending YOLO V2[3] to include the height and 3D OBB center coordinates (x,y,z) as a direct regression task.
3- Real-time performance evaluation and experimentation with Titan X GPU, on the challenging KITTI benchmark, with recommendations of the best grid-map resolution, and operating IoU threshold that balances speed and accuracy.
1- 扩展 YOLO V2[3] 以包含 OBB 的方向作为直接回归任务。
2- 扩展 YOLO V2[3] 以包含高度和 3D OBB 中心坐标 (x,y,z) 作为直接回归任务。
3- 在具有挑战性的 KITTI 基准测试中使用 Titan X GPU 进行实时性能评估和实验,并提供最佳网格图分辨率的建议,以及平衡速度和准确性的操作 IoU 阈值。
The results evaluated on KITTI benchmark shows a clear advantage of the proposed approach, in terms of real-time efficiency (40 fps), and a promising accuracy. The rest of the paper is organized as follows: first, we discuss the related works, followed by a description of the proposed approach, and the combined one-shot loss for the 3D OBB, then we present, and discuss the experimental results on the KITTI benchmark dataset. Finally, we provide concluding remarks in section 5.
在 KITTI 基准测试中评估的结果显示了所提出的方法在实时效率 (40 fps) 和有希望的准确性方面的明显优势。 本文的其余部分组织如下:首先,我们讨论相关工作,然后描述所提出的方法,以及 3D OBB 的组合单次损失,然后我们介绍并讨论在 KITTI 基准数据集。 最后,我们在第 5 节提供总结性评论。
2 Related Work
In this section, we summarize 3D object detection in autonomous driving for LiDAR point clouds. We then summarize related works in orientation prediction, which we use to predict the real angle of the vehicle. Finally, we discuss the implications of 3D object detection on the real-time performance.
在本节中,我们总结了 LiDAR 点云自动驾驶中的 3D 目标检测。 然后我们总结了方向预测中的相关工作,我们用它来预测车辆的真实角度。 最后,我们讨论了 3D 对象检测对实时性能的影响。
2.1 3D Object Detection
There are three ways to do 3D object detection in terms of sensor type. Firstly, it is the LIDAR-only paradigm, which benefits from accurate depth information. Overall, these paradigms differ in data preprocessing. Some approaches project point cloud in 2D view (Bird-View, Front-View) such as[4] and [5]; and some [6] convert the point cloud to a front view depth map. Others like [7] and [8], convert the point cloud to voxels producing a discrete square grid.
就传感器类型而言,有三种方法可以进行 3D 对象检测。 首先,它是 LIDAR-only 范式,它受益于准确的深度信息。 总的来说,这些范式在数据预处理方面有所不同。 一些方法在 2D 视图(鸟瞰、前视图)中投影点云,例如 [4] 和 [5]; 和一些 [6] 将点云转换为前视图深度图。 其他人如 [7] 和 [8],将点云转换为体素,产生离散的方形网格。
The Second one is the camera-only paradigm; which works by adding prior knowledge about the objects’ sizes, and trying to predict 3D bounding box using monocolor camera.[9] and [10] can produce highly accurate 3D bounding boxes using only camera images.[11] uses stereo vision to produce high-quality 3D object detection.
第二个是仅相机范式; 它的工作原理是添加有关对象大小的先验知识,并尝试使用单色相机预测 3D 边界框。 [9] 和 [10] 仅使用相机图像即可生成高度准确的 3D 边界框。 [11] 使用立体视觉产生高质量的 3D 对象检测。
The LIDAR-camera fusion comes at the last. This paradigm tries to utilize the advantages of both paradigms mentioned above. The LIDAR produces accurate depth information, and the camera produces rich visual features; if we combine the output of the two sensors, we can have more accurate object detection and recognition. MV3D[5] fuses bird view, front view and the RGB camera to produce 3D vehicle detection. F-pointnet[12] combines raw point cloud with RGB camera images. Object detection on RGB image produces a 2D bounding box which maps to a frustum in the point cloud. Then, 3D object detection is performed directly on frustum to produce accurate bounding boxes. However, fusing lidar data with camera suffers from adding more time complexity to the problem.
LIDAR-camera 融合出现在最后。 这种范式试图利用上述两种范式的优点。 激光雷达产生准确的深度信息,相机产生丰富的视觉特征; 如果我们结合两个传感器的输出,我们可以有更准确的物体检测和识别。 MV3D[5] 融合鸟瞰图、前视图和 RGB 摄像头以产生 3D 车辆检测。 F-pointnet[12] 将原始点云与 RGB 相机图像相结合。 RGB 图像上的对象检测会生成一个 2D 边界框,该边界框映射到点云中的截锥体。 然后,直接在视锥体上执行 3D 对象检测以生成准确的边界框。 然而,将激光雷达数据与相机融合会增加问题的时间复杂度。
In this work, we are following the first paradigm of using only lidar point cloud projected as special bird view grid to keep the 3D information, more details will be discussed in section III-A.
在这项工作中,我们遵循仅使用激光雷达点云投影作为特殊鸟瞰网格来保留 3D 信息的第一个范例,更多细节将在第 III-A 节中讨论。
2.2 Orientation Prediction
One approach in finding the orientation is introduced by MV3D[5], where the orientation vector is assumed to be in the direction of the longer side of the box. This approach fails in regards to pedestrians because they don’t obey this rule.
MV3D[5] 引入了一种寻找方向的方法,其中假设方向向量在box的较长边的方向上。 这种方法对行人来说是失败的,因为他们不遵守这条规则。
Another approach is to convert the orientation vector to its component, as shown in [13] and [14]. AVOD[13] converts the orientation vector to sine and cosine. Complex YOLO[14] converts the orientation vector to real and imaginary values. The problem with this is that the regression does not guarantee, or preserve any type of correlation between the two components of the angle.
另一种方法是将方向向量转换为其分量,如 [13] 和 [14] 所示。 AVOD[13] 将方向向量转换为正弦和余弦。 Complex YOLO[14] 将方向向量转换为实数值和虚数值。 问题在于回归不能保证或保留角度的两个分量之间的任何类型的相关性。
2.3 Real Time Performance
Object detection is fundamental to automated driving, yet it suffers from computational complexity. There is a need to make the models as efficient as possible in terms of size and inference time maintaining a good accuracy.
目标检测是自动驾驶的基础,但它受到计算复杂性的影响。 需要使模型在大小和推理时间方面尽可能高效,并保持良好的准确性。
Some work has been done to tackle the efficiency of models, such as SqueezeNet [15], Mobile-Net [16], and Shuffle-Net [17], and for object detection, there is Tiny YOLO and Tiny SSD [18]. All these architectures are optimized for camera images, and they cannot easily be adapted to work on images produced from LiDAR point clouds. The reason is that, unlike camera images, LiDAR images consist of very sparse information. Vote3Deep [19] performs 3D sparse convolution to take advantage of this sparsity.
已经做了一些工作来解决模型的效率问题,例如 SqueezeNet [15]、Mobile-Net [16] 和 Shuffle-Net [17],对于目标检测,有 Tiny YOLO 和 Tiny SSD [18]。 所有这些架构都针对相机图像进行了优化,并且无法轻松适应从 LiDAR 点云生成的图像。 原因是,与相机图像不同,LiDAR 图像包含非常稀疏的信息。 Vote3Deep [19] 执行 3D 稀疏卷积以利用这种稀疏性。
Extending YOLOv2 [3], we include the orientation of the OBB as a direct regression task, unlike the work in [14], which suggests two separate losses for the real and imaginary parts of the angle, without explicit nor implicit correlation between them, which may result in wrong or invalid angles in many cases.
扩展 YOLOv2 [3],我们将 OBB 的方向作为直接回归任务包括在内,这与 [14] 中的工作不同,后者建议角度的实部和虚部有两个单独的损失,它们之间没有明确或隐含的相关性, 在许多情况下,这可能会导致错误或无效的角度。
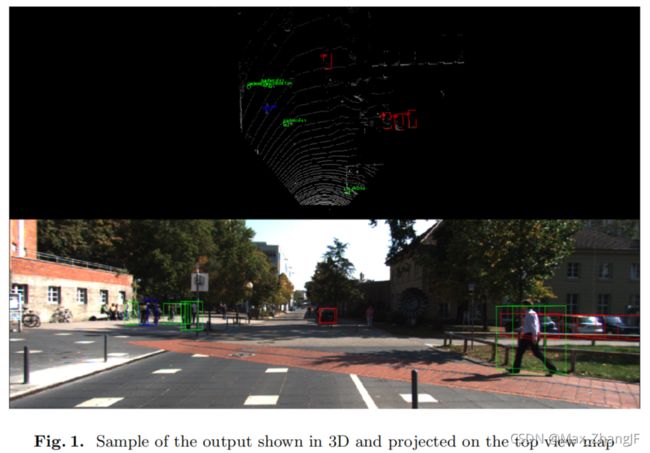
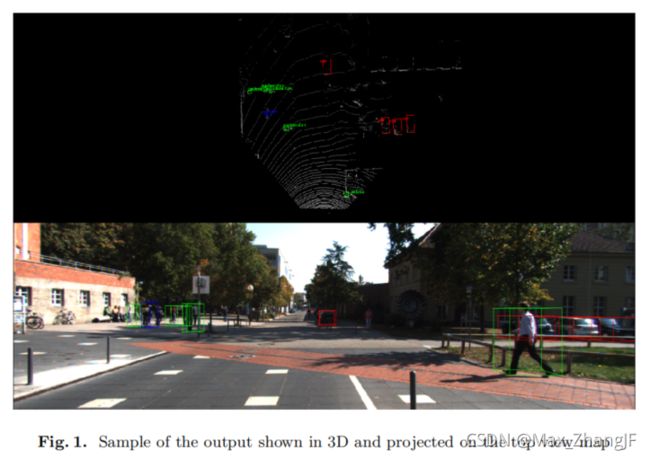
In addition, in [14], 3D OBB height and z-center are not a natural or exact output from the network, but rather a heuristic based on statistics and average sizes of the data. In this work, we extend YoLo v2[3] to include height and 3D OBB center as direct regression tasks. A sample of our output can be seen in Figure (1), taken from KITTI benchmark test data.
此外,在 [14] 中,3D OBB 高度和 z 中心不是网络的自然或精确输出,而是基于统计数据和平均数据大小的启发式方法。 在这项工作中,我们扩展了 YoLo v2[3] 以将高度和 3D OBB 中心作为直接回归任务包括在内。 我们的输出示例如图 (1) 所示,取自 KITTI 基准测试数据。
3 Approach
3.1 Point Cloud Representation
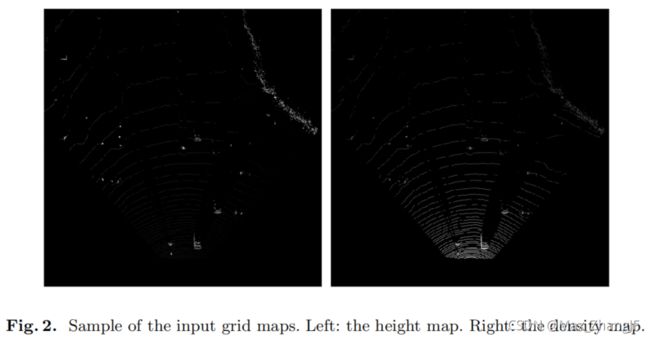
We project the point cloud to create a bird’s eye view grid map. We create two grid maps from the projection of the point cloud as shown in Figure (2). The first feature map contains the maximum height, where each grid cell (pixel) value represents the height of the highest point associated with that cell. The second grid map represent the density of points. Which means, the more points are associated with a grid cell, the higher its value would be. The density is calculated using the following equation taken from MV3D paper [5]:
我们投影点云以创建鸟瞰图网格图。 我们从点云的投影创建两个网格图,如图(2)所示。 第一个特征图包含最大高度,其中每个网格单元(像素)值表示与该单元关联的最高点的高度。 第二个网格图表示点的密度。 这意味着,与网格单元关联的点越多,其值就越高。 使用从 MV3D 论文 [5] 中获取的以下等式计算密度:

3.2 Yaw Angle Regression 偏航角回归
The orientation of the bounding boxes has a range from -π to π. We normalized that range to be from -1 to 1, and adapted our model to directly predict the orientation of the bounding box via a single regressed number. In the loss function, we compute the mean squared error between the ground truth and our predicted angle:
边界框的方向范围从 -π 到 π。 我们将该范围归一化为 -1 到 1,并调整我们的模型以通过单个回归数直接预测边界框的方向。 在损失函数中,我们计算地面实况和我们预测的角度之间的均方误差:

In our experimentation, we used using tanh as an activation for the angle output yaw (to bound the output between -1 and 1), but it did not offer an improvement over the linear activation.
在我们的实验中,我们使用 tanh 作为偏航角输出的激活(将输出限制在 -1 和 1 之间),但它没有提供对线性激活的改进。
3.3 3D Bounding Box Regression
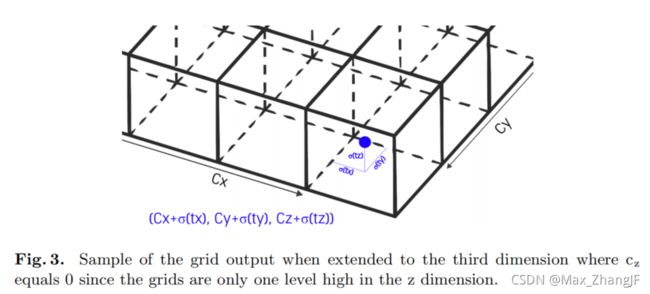
We added two regression terms to the original YOLO v2[3] in order to produce 3D bounding boxes, the z coordinate of the center, and the height of the box. The regression over the z coordinate in Eq. (5) is done in a way similar to the regression of the x Eq. (3) and y Eq. (4) coordinates via a sigmoid activation function.
我们在原始 YOLO v2[3] 中添加了两个回归项以生成 3D 边界框:中心的 z 坐标和框的高度。 方程(5)中 z 坐标的回归以类似于方程(3)和方程(4) x 和 y的回归的方式完成,通过 sigmoid 激活函数进行坐标。

While the x and y are regressed by predicting a value between 0 and 1 at each grid cell, locating where the point lies within that cell, the value of z is only mapped to lie within one vertical grid cell as illustrated in Figure (3). The reason for choosing to map z values to only one grid while x and y are mapped to several grid cells is that the variability of values in the z dimension are much smaller than that of the x and y (most objects have very similar box elevations).
虽然 x 和 y 通过在每个网格单元中预测 0 到 1 之间的值进行回归,定位该点位于该单元内的位置,但 z 的值仅映射到位于一个垂直网格单元内,如图 (3) 所示 . 选择将 z 值仅映射到一个网格而将 x 和 y 映射到多个网格单元的原因是 z 维度中值的可变性远小于 x 和 y 的可变性(大多数对象具有非常相似的框高程 )。
The height of the box h Eq. (8) is also predicted similarly to the width w in Eq. (6) and length l in Eq. (7)
盒子的高度 h 方程(8)也与等式(6)中的宽度 W 和等式(7)中的长度 L 相似。
3.4 Anchors Calculation
In YOLO-v2 [3], anchors are calculated using k-means clustering over the width and length of the ground truth boxes. The point behind using anchors, is to find priors for the boxes, onto which the model can predict modifications. The anchors must be able to cover the whole range of boxes that can appear in the data. In [3], the model is trained on camera images, where there is a high variability of box sizes, even for the same object class. Therefore, calculating anchors using clustering is beneficial.
在 YOLO-v2 [3] 中,使用 k-means 聚类在地面实况框的宽度和长度上计算锚点。 使用锚点背后的要点是找到先验框,模型可以预测修改。 锚点必须能够覆盖可以出现在数据中的所有框。 在 [3] 中,模型是在相机图像上训练的,即使对于相同的对象类,其中的框大小也存在很大的可变性。 因此,使用聚类计算锚点是有益的。
On the other hand, in the case of bird’s eye view grid maps, there is no such high variability in box dimensions within the same object class (most cars have similar sizes). For this reason, we chose not to use clustering to calculate the anchors, and instead, calculate the mean 3D box dimensions for each object class, and use these average box dimensions as our anchors.
另一方面,在鸟瞰网格图的情况下,同一对象类中的框尺寸没有如此高的可变性(大多数汽车具有相似的尺寸)。 出于这个原因,我们选择不使用聚类来计算锚点,而是计算每个对象类的平均 3D 框尺寸,并将这些平均框尺寸用作我们的锚点。
3.5 Combined Loss for 3D OBB
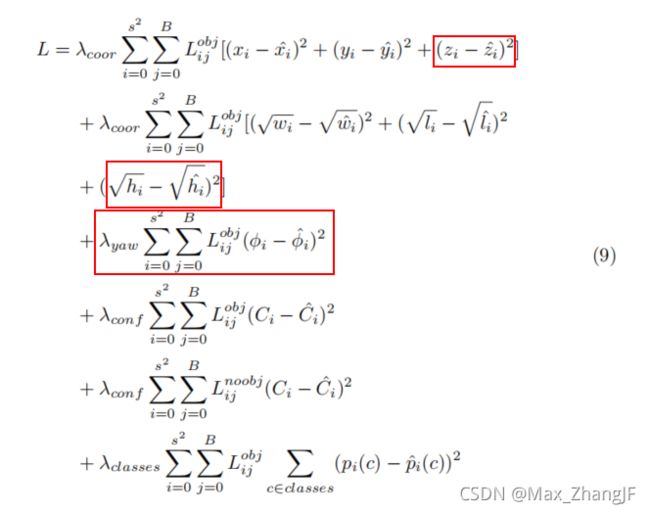
The loss for 3D oriented boxes is an extension to the original YOLO loss for 2D boxes. The loss for the yaw term is calculated as described in subsection B and Eq. (2). The loss for the height is an extension to the loss over the width and length in (9). Similarly, the loss for the z coordinate is an extension to the loss over the x and y coordinates, as shown in (9).
3D 方向盒的损失是 2D 盒原始 YOLO 损失的扩展。 偏航项的损失按照 B 小节和等式(2)计算。高度的损失是(9)中宽度和长度损失的延伸。 类似地,z 坐标的损失是 x 和 y 坐标损失的扩展,如(9)所示。
The total loss shown in Eq. (9) is calculated as the scaled summation of the following terms: the mean squared error over the 3D coordinates and dimensions (x, y, z, w, l, h), the mean squared error over the angle, the confidence score, and the cross entropy loss over the object classes.
等式(9)中显示的总损失计算为以下项的缩放总和:3D 坐标和维度(x、y、z、w、l、h)上的均方误差、角度上的均方误差、置信度得分, 以及对象类的交叉熵损失。
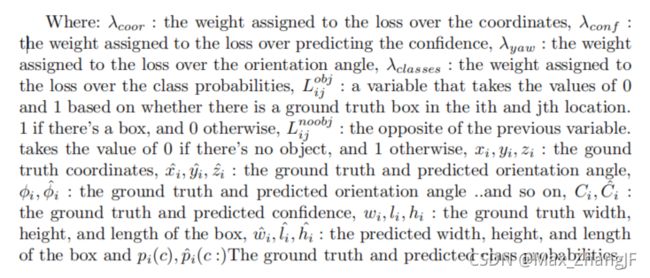
其中: λcoor :分配给坐标损失的权重, λconf :分配给预测置信度损失的权重, λyaw :分配给方向角损失的权重, λclasses :分配给损失的权重 类概率,L obj ij :一个变量,它根据第 i 个和第 j 个位置中是否存在真实值框取 0 和 1 的值。如果有一个盒子,则为 1,否则为 0,L noobj ij :与前一个变量相反。如果没有物体,则取值为 0,否则取值为 1, xi , yi , zi :地面实况坐标, xˆi, yˆi, zˆi :地面实况和预测方向角, φi, φˆi :地面实况和预测方向角 …等, Ci, Cˆi : 真实情况和预测置信度, wi , li , hi : 真实情况宽度、高度和盒子的长度, wˆi, lˆi, hˆi : 预测宽度、高度和长度 框和 pi( c)、p^i( c) 真实情况和预测的类别概率。
4 Experiments and Results
4.1 Network Architecture and Hyper Parameters
Our model is based on YOLO-v2[3] architecture with some changes, as shown in Table 1.
我们的模型基于YOLO-v2[3]架构,做了一些修改,如表1所示。
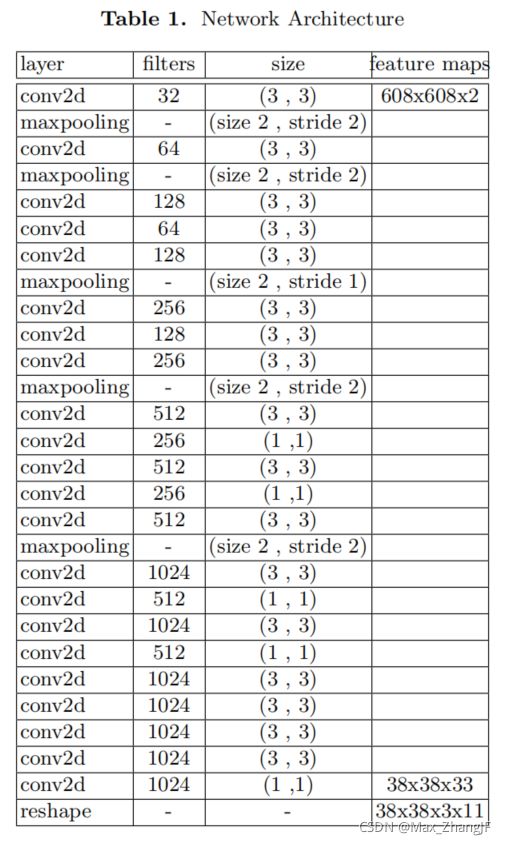
- We modified one max-pooling layer to change the down-sampling from 32 to 16 so we can have a larger grid at the end; this has a contribution in detecting small objects like pedestrians and cyclists.
- We removed the skip connection from the model as we found it resulting in less accurate results.
- We added terms in the loss function for yaw, z center coordinate, and height regressions to facilitate the 3D oriented bounding box detection.
- Our input consists of 2 channels, one representing the maximum height, and the other one representing the density of points in the point cloud, computed as shown in Eq. (1).
1. 我们修改了一个最大池化层,将下采样从 32 改为 16,这样我们最终可以有一个更大的网格; 这有助于检测行人和骑自行车的人等小物体。
2. 我们从模型中删除了skip connection,因为我们发现它会导致结果不太准确。
3. 我们在偏航、z 中心坐标和高度回归的损失函数中添加了项,以促进 3D 定向边界框检测。
4. 我们的输入由 2 个通道组成,一个表示最大高度,另一个表示点云中点的密度,如公式 1 所示计算。
4.2 Dataset and Preprocessing
We used KITTI benchmark dataset. The point cloud was projected in 2D space as a bird view grid map with a resolution of 0.1m per pixel, same resolution is used by MV3D[5].
The range represented from the LiDAR space by the grid map is 30.4 meters to right and 30.4 meters to the left, and 60.8 meters forward. Using this range with the above mentioned resolution of 0.1 results in an input shape of 608x608 per channel.
The height in the LiDAR space is clipped between +2m and -2m, and scaled to be from 0 to 255 to be represented as pixel values in the maximum height channel.
Since in KITTI benchmark only the objects that lies on the image plane are labeled, we filter any points from the point cloud that lie outside the image plane.
The rationale behind this, is to avoid giving the model contradictory information.Since objects lying on the image plane would need to be detected, while the ones lying outside that plane should be ignored, as they are not labeled. Therefore, we only include the points that lie within the image plane.
我们使用了 KITTI 基准数据集。 点云以每像素 0.1m 的分辨率在 2D 空间中投影为鸟瞰网格图,MV3D [5] 使用相同的分辨率。
网格图表示的 LiDAR 空间范围为向右 30.4 米,向左 30.4 米,向前 60.8 米。 在上述分辨率为 0.1 的情况下使用此范围会导致每个通道的输入形状为 608x608。
LiDAR 空间中的高度剪裁在 +2m 和 -2m 之间,并缩放到 0 到 255 以表示为最大高度通道中的像素值。
由于在 KITTI 基准测试中仅标记位于图像平面上的对象,因此我们从点云中过滤位于图像平面之外的任何点。
这背后的基本原理是避免给模型提供矛盾的信息。由于需要检测位于图像平面上的对象,而应忽略位于该平面外的对象,因为它们没有被标记。 因此,我们只包括位于图像平面内的点。
4.3 Training
The network is trained in an end-to-end fashion. We used stochastic gradient descent with a momentum of 0.9, and a weight decay of 0.0005. We trained the network for 150 epochs, with a batch size of 4.
Our learning rate schedule is as follows: for the first few epochs, we slowly raise the learning rate from 0.00001 to 0.0001. If we start at a high learning rate, our model often diverges due to unstable gradients. We continue training with 0.0001 for 90 epochs, then 0.0005 for 30 epochs, and finally, 0.00005 for the last 20 epochs.
该网络以端到端的方式进行训练。 我们使用了动量为 0.9、权重衰减为 0.0005 的随机梯度下降。 我们将网络训练了 150 个 epoch,批量大小为 4。
我们的学习率计划如下:对于前几个 epoch,我们将学习率从 0.00001 慢慢提高到 0.0001。 如果我们以高学习率开始,我们的模型通常会因梯度不稳定而发散。 我们继续用 0.0001 训练 90 个时期,然后用 0.0005 训练 30 个时期,最后用 0.00005 训练最后 20 个时期。
4.4 KITTI Results and Error Analysis
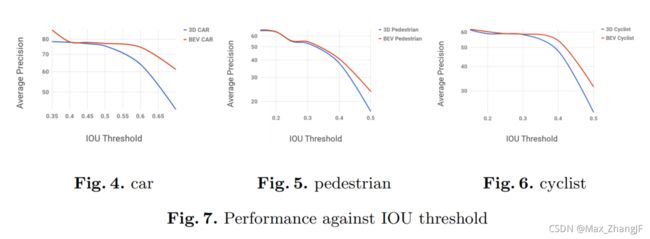
As discussed in [20], and from the results reported in [1] and [3], YOLO performs very well with the detection metric of mean average precision at IOU threshold of 0.5. This gives us an advantage over the previous work in 3D detection from point cloud in terms of speed with an accepted mAP, as shown in Figure (7).
However, performance drops significantly as the IOU threshold increases indicating that we struggle to get the boxes perfectly aligned with the object, which is an inherited problem in all YOLO versions [1], [3], [20]. Fig 7 shows that the model succeeds in detecting the objects but struggles with accurately localizing them.
正如[20]中所讨论的,以及从[1]和[3]中报告的结果来看,YOLO在IOU阈值为0.5的平均精度检测指标上表现非常好。 就速度而言,这使我们比以前从点云进行 3D 检测的工作更具优势,使用可接受的 mAP,如图(7)所示。
然而,随着 IOU 阈值的增加,性能显着下降,这表明我们很难使框与对象完美对齐,这是所有 YOLO 版本 [1]、[3]、[20] 中的一个继承问题。 图 7 显示该模型成功检测到对象,但难以准确定位它们。
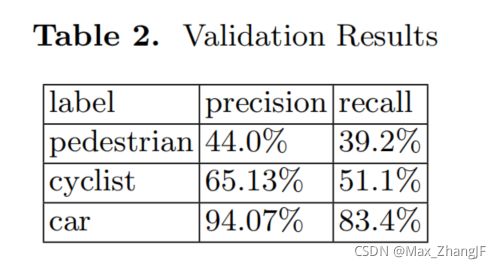
Compared with the state of the art approaches on 3D object detection, such as MV3D[5], which fails in detecting pedestrians and cyclists despite its relatively large, and complex multi view, multi sensor network, as well as, AVOD[13], which dedicates a separate network for detecting cars, and one for pedestrians and cyclists, our proposed architecture can detect all objects from only a two channel bird view input, and with just one single network, achieving a real time performance of 40 fps , and a 75.3% mAP on 0.5 IOU threshold for moderate cars. The precision and recall scores on our validation set (about 40% of the KITTI training set) are shown in Table 2.
与 3D 物体检测的最先进方法(例如 MV3D[5])相比,尽管其相对较大且复杂的多视图、多传感器网络以及 AVOD[13],但仍无法检测行人和骑自行车的人, 它专门用于检测汽车的单独网络,以及用于行人和骑自行车的人,我们提出的架构可以仅从两个通道的鸟瞰图输入中检测所有对象,并且仅使用一个网络,实现了 40 fps 的实时性能,以及 中型汽车在 0.5 IOU 阈值上的 75.3% mAP。 我们的验证集(大约是 KITTI 训练集的 40%)的准确率和召回率分数如表 2 所示。
4.5 Effect of Grid Map Resolution
Grid map resolution is a critical hyper-parameter that affect memory usage, time and performance. For instance, if we want to deploy the model on an embedded target, we have to focus on fast inference time with small input size, and reasonable performance.
The area of the grid map grows proportionally to the length or width of the grid map squared. This means increasing the resolution of the grid map, increases the area of the grid map (and thus the inference time) quadratically. This can be seen in Figure (8), where there is a rapid increase in the inference time after the 0.15 meter/pixel mark, where only increasing the resolution by 0.05 meters/pixel (from 0.15 meters/pixel to 0.1 meter/pixel) causes the inference time to double from 16.9ms to 30.8ms.
网格地图分辨率是影响内存使用、时间和性能的关键超参数。 例如,如果我们想在嵌入式目标上部署模型,我们必须专注于快速的推理时间、小输入大小和合理的性能。
网格地图的面积与网格地图的平方长度或宽度成比例增长。 这意味着增加网格图的分辨率,平方增加网格图的面积(从而增加推理时间)。 这在图(8)中可以看出,在0.15米/像素标记后推理时间快速增加,其中分辨率仅增加0.05米/像素(从0.15米/像素到0.1米/像素) 导致推理时间从 16.9ms 翻倍到 30.8ms。
5 Conclusions
In this paper we present real-time LiDAR based system for 3D OBB detection and classification, based on extending YOLO-v2[3]. The presented approach is trained end to end, without any pipelines of region proposals which ensure real time performance in the inference pass. The box orientation is ensured by direction regression on the yaw angle in bird-view. The 3D OBB center coordinates and dimensions are also formulated as a direct regression task, with no heuristics. The system is evaluated on the official KITTI benchmark at different IoU thresholds, with recommendation of the best operating point to get real time performance and best accuracy. In addition, the real time performance is evaluated at different grid-map resolutions. The results suggest that single shot detectors can be extended to predict 3D boxes while maintaining real-time performance; however this comes with a cost on the localization accuracy of the boxes.
在本文中,我们在扩展 YOLO-v2[3] 的基础上,提出了基于实时 LiDAR 的系统,用于 3D OBB 检测和分类。 所提出的方法是端到端的训练,没有任何区域提议的管道,以确保推理过程中的实时性能。 盒子的方向是通过鸟瞰中偏航角的方向回归来确保的。 3D OBB 中心坐标和尺寸也被制定为直接回归任务,没有启发式。 该系统在不同 IoU 阈值的官方 KITTI 基准测试中进行评估,并推荐最佳操作点以获得实时性能和最佳精度。 此外,实时性能在不同的网格地图分辨率下进行评估。 结果表明,单次检测器可以扩展到预测 3D 框,同时保持实时性能; 然而,这会降低盒子的定位精度。
