pandas(2)DataFrame
pandas(2)DataFrame
本节目标:DataFrame的概念和操作
本节技术点:DataFrame
本节阅读需要(15)min。
本节实操需要(15)min。
文章目录
- pandas(2)DataFrame
- 前言
- 一、DataFrame的创建
-
- by series掌握
- byndarray掌握
- by其他数据结构(了解)
- 二、DataFrame基础操作(掌握)
-
- df的基本信息
- 列操作
- 数学计算
- 转置
- 比较
- 转化为ndarray
- 三、内置的方法(掌握)
-
- Head and tail
- describe()
- isna()
- 总结
前言
DataFrame is a 2-dimensional labeled data structure with columns of potentially different types. You can think of it like a spreadsheet or SQL table, or a dict of Series objects. It is generally the most commonly used pandas object. Like Series, DataFrame accepts many different kinds of input:
Dict of 1D ndarrays, lists, dicts, or Series
2-D numpy.ndarray
Structured or record ndarray
A Series
Another DataFrame
其实就是DataFrame 是二维的。可以从ndarray,Series等转化而来。
实际上DataFrame一般是作为数据入口的接受sql里面的或者用户提交的Excel表格初始化分析数据的。
一、DataFrame的创建
pandas.DataFrame( data, index, columns, dtype, copy)
by series掌握
前面见过了series是DataFrame的基础。当然也是最重要的构成方式。因为往往具有现实意义。
d = {
    "one": pd.Series([1.0, 2.0, 3.0], index=["a", "b", "c"]),
    "two": pd.Series([1.0, 2.0, 3.0, 4.0], index=["a", "b", "c", "d"]),
}
df = pd.DataFrame(d)
pd.DataFrame(d, index=["d", "b", "a"])
   one  two
d  NaN  4.0
b  2.0  2.0
a  1.0  1.0
pd.DataFrame(d, index=["d", "b", "a"], columns=["two", "three"])
   two three
d  4.0   NaN
b  2.0   NaN
a  1.0   NaN
注意上面的输出结果。
我们可以得到如下结论:
- DataFrame是高度容许错误的。没有的会用NaN补齐,不管是行还是列。
- index相当于行,columns相当于列。
- 每一个series是作为一列存在的。因为往往代表了同一属性,比如身高,体重等。
byndarray掌握
从二维的ndarray而来也是很普遍的。
data = [['Google',10],['Runoob',12],['Wiki',13]]

df = pd.DataFrame(data,columns=['Site','Age'],dtype=float) # 如果dtype不全会自动扩展
这里的int整数被扩展为了float类型,最好传入一个和列名长度相等的的dtype列表
同一列要求一样的数据类型,有一个float,所有的int都会变成float。
by其他数据结构(了解)
不着重讲解,注意形式就可以了。
d = {"one": [1.0, 2.0, 3.0, 4.0], "two": [4.0, 3.0, 2.0, 1.0]} # 列名
pd.DataFrame(d, index=["a", "b", "c", "d"]) # 行名
data = np.zeros((2,), dtype=[("A", "i4"), ("B", "f4"), ("C", "a10")])
data[:] = [(1, 2.0, "Hello"), (2, 3.0, "World")]
data2 = [{"a": 1, "b": 2}, {"a": 5, "b": 10, "c": 20}]
pd.DataFrame(data2)
如果是用字典,那么字典的键一般是DataFrame的列名。
这么多其实很少用的到。
主要是知道DataFrame有行名和列名。
二、DataFrame基础操作(掌握)
df的基本信息
d = {"one": [1.0, 2.0, 3.0, 4.0], "two": [4.0, 3.0, 2.0, 1.0]} # 列名

df = pd.DataFrame(d, index=["a", "b", "c", "d"]) # 行名

print(df.columns) # 列
print(len(df.columns))
print(df.shape[1])
print(df.index) # 行
print(len(df.index))
print(df.shape[0])
列操作
d = {"one": [1.0, 2.0, 3.0, 4.0], "two": [4.0, 3.0, 2.0, 1.0]} # 列名
df = pd.DataFrame(d, index=["a", "b", "c", "d"]) # 行名
df["one"] # 列索引
df["three"] = df["one"] * df["two"] # 列初始化并赋值,遵循矢量运算
df["flag"] = df["one"] > 2 # 也是初始化,但相当于矢量化的if判断
# 删除一个列
del df["two"] # 无返回值
three = df.pop("three") # 有返回值
# 增加一个列
df["foo"] = "bar" # 只有一个值会发生类似广播的效果。
df["one_trunc"] = df["one"][:2] # 长度不足会用NaN补齐
# 插入,可以选择位置
df.insert(1, "bar", df["one"])
df["three"] = df["one"] * df["two"] 通过赋值初始化的列是按顺序追加在后面的。
insert是可以根据位置插入的。
from sklearn.datasets import load_iris
import pandas as pd
data = load_iris()

iris = pd.DataFrame(data.data, columns=data.feature_names) # 读入iris数据集
iris.assign(sepal_ratio=iris["SepalWidth"] / iris["SepalLength"]).head()
iris.assign(sepal_ratio=lambda x: (x["SepalWidth"] / x["SepalLength"])).head() # 相当于手动实现了如上的矢量运算

iris.query("SepalLength > 5") # 筛选器,会生成新的df对象
    .assign(
        SepalRatio=lambda x: x.SepalWidth / x.SepalLength,
        PetalRatio=lambda x: x.PetalWidth / x.PetalLength,
    )
    .plot(kind="scatter", x="SepalRatio", y="PetalRatio")
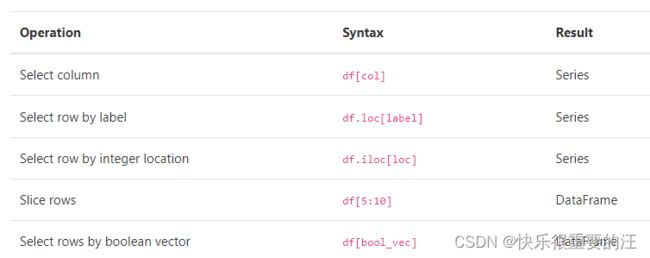
这张图十分重要。
值得强调的是,[]直接选择的是单个列名,返回的是series。但是看上去很像的切片确实按行的序号,返回的是df
另外形如dogs[[‘breed’, ‘size’]]多个列名采用列表,本质产生了新的df,相当于取了子集。
数学计算
DataFrame的各类计算基本上都是按行或列进行矢量运算的。
df = pd.DataFrame(np.random.randn(10, 4), columns=["A", "B", "C", "D"])
df2 = pd.DataFrame(np.random.randn(7, 3), columns=["A", "B", "C"])
df + df2 # 行列都是对位进行运算
有NaN参与的的运算还是NaN
所以补齐的地方都是NaN。
df - df.iloc[0] # 所有的行依次减去第一行
df * 5 + 2 # 四则运算相当于矩阵的数乘操作,对美一个元素生效
df = pd.DataFrame(
    {
        "one": pd.Series(np.random.randn(3), index=["a", "b", "c"]),
        "two": pd.Series(np.random.randn(4), index=["a", "b", "c", "d"]),
        "three": pd.Series(np.random.randn(3), index=["b", "c", "d"]),
    }
)
row = df.iloc[1]
column = df["two"]
df.sub(row, axis="columns") # df.sub(row, axis=1)
df.sub(column, axis="index") # df.sub(column, axis=0)
注意:
默认的axis=1,所以列远远比行重要
转置
df[:5].T # 截取前四列,然后行列转置
比较
要求shape一致
NaN会作为0处理。
eq, ne, lt, gt, le, and ge
df.gt(df2) # df > df2
得到的bool矩阵可以用如下的来降维概括。
empty, any(), all(), and bool() to provide a way to summarize a boolean result.
(df > 0).all() # 按列总结,都对才对
(df > 0).any() # 按列总结,有对就对
(df > 0).any().any() # 压缩成一维了
df + df == df * 2 # 有可能不等的,等价于(df + df).equals(df * 2)
虽然上面说是NaN按照0处理。但是在比较的时候
np.nan == np.nan
 False
牢记!!!
转化为ndarray
np.asarray(df) # 生成二维的adarray
df.to_numpy()
这样就可以开心使用numpy的各种计算方式了。
三、内置的方法(掌握)
Head and tail
和print类似可以用来debug,只显示前几行,可以快速查看是否符合目标。
index = pd.date_range("1/1/2000", periods=8)
df = pd.DataFrame(np.random.randn(8, 3), index=index, columns=["A", "B", "C"])
describe()
会对于每一列计算常见的统计值。
mean
std
min
25%
50%
75%
max
isna()
判断是否为缺省值,返回一个boolen矩阵
总结
最重要的是要知道:
- 如何生成新的列.类似字典插入,赋值就相当于创建,只不过赋值升级了,换成了列而已.
- 生成新的df对象.通过筛选器就可以产生新的df对象,哪怕一模一样,什么操作都没有!!!
注意:
- 在现实情况下,列的操作是占据绝对主要的。
- DataFrame上游数据绝大部分是csv数据或者sql数据
- 本节出现了很多行列不匹配的情形,都会出现扩展.但是实际问题中,行列都是要求一致的,不一致的一般作为杂质清洗掉!!!
延伸阅读:
下一节讲DataFrame的各种数据类型的读入和读出。
