Python 绘图
导入相关库:
import matplotlib.pyplot as plt
import numpy as np
x = np.linspace(-1, 1, 50) # [-1, 1]内均匀取50个点
y1 = 2 * x + 1
y2 = x ** 2

plt.plot(x, y1) # 以x为横坐标,y为纵坐标作图,直线/平滑曲线连接
plt.scatter(x, y2) # 散点图
plt.show() # 显示图

plt.plot([0, 1], [3, 5]) # 用直线连接(0, 3)、(1, 5)两点

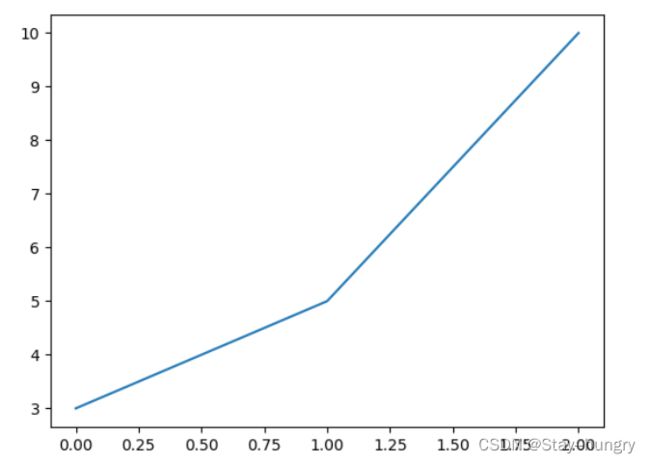
plt.plot([0, 1, 2], [3, 5, 10]) # 折线连接(0, 3), (1, 5), (2, 10)
plt.figure()用于创建创建一个figure区,括号内可以传入一些参数:
plt.figure(num = 3, figsize = (8, 5)) # 图的编号为Figure3,尺寸为:8×5
...  # 所有处理都是在当前figure中
x = np.linspace(-1, 1, 50)
y1 = 2 * x + 1
y2 = x ** 2

plt.figure()
plt.plot(x, y1)

plt.figure()
plt.plot(x, y2)

plt.show()
可以在一个figure中绘多个图像:
plt.figure()
plt.plot(x, y1)
plt.plot(x, y2, color='red', linewidth=1.0, linestyle='--') # 线条颜色为红色,粗度为1, 风格为虚线
plt.show()

参考资料
设置坐标轴属性:
plt.xlim((-10, 20)) # 设置图片中所显示的x轴部分范围
plt.ylim((1, 10))
plt.xlabel('x') # 设置x轴标题
plt.ylabel('y')

plt.xticks((1, 4, 5)) # 参数为一个元组,设置特别显示的x坐标
plt.yticks((2, 6)) # 设置特别显示的x坐标

plt.xticks(np.linspace(-1, 1, 5)) # 在[-1, 1]中等分取5点
plt.yticks(np.linspace(-4, 4, 9)) # 在[-4, 4]中等分取9点

可以将指定的坐标以文字来代替:
plt.xticks(np.linspace(-1, 1, 5))
plt.yticks([-1, 0, 1], ['bad', 'normal', 'good'])

文字可以使用类似LaTeX的形式:
plt.yticks([-1, 0, 1], [r'$\alpha$', r'$\beta$', r'$\lambda$']) # 前面加个r

ax = plt.gca() # 获取4个边框
ax.spines['right'].set_color('none') # 将右边框设置为无色
ax.spines['top'].set_color('none')  # 将上边框设置为无色

ax.spines['bottom'].set_position(('data', 0)) # 将x轴设在y=0处
ax.spines['left'].set_position(('data', 0)) # 将y轴设在x=0处

# 设置坐标轴上的数字显示的位置,top:显示在顶部  bottom:显示在底部,默认是none
ax.xaxis.set_ticks_position('top')
ax.yaxis.set_ticks_position('right')

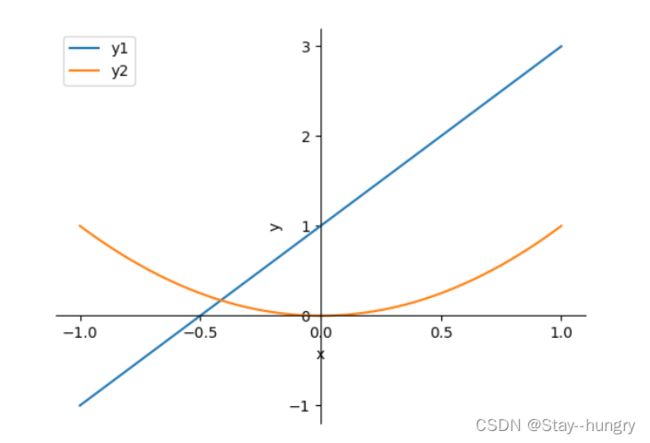
plt.plot(x, y1, label='y1') # 设置曲线的标签
plt.plot(x, y2, label='y2')
plt.legend() # 显示图例
# plt.legend(loc='best')
plt.plot(x, y1)
x0 = 0.5
y0 = 2 * x0 + 1
plt.scatter(x0, y0, s=50, color='b') # 用蓝色描出一点,尺寸为50
plt.plot([x0, x0], [y0, 0], 'k--', lw=2.5) # 用虚线连接(x0, y0)和(x0, 0)两点, 颜色为k(黑色),虚线的粗度为2.5

plt.annotate(r'$2x+1=%s$' % y0, xy=(x0, y0), xycoords='data', xytext=(+30, -30), textcoords='offset points', fontsize=16, arrowprops=dict(arrowstyle='->', connectionstyle='arc3, rad=.2'))

plt.text(-1, 1, 'texttext') # 文本,从(-1, 1)点处开始写起

import matplotlib.pyplot as plt
import numpy as np

# x = np.linspace(-1, 1, 50)
# y1 = 2 * x + 1
plt.figure()
plt.xlabel('x')
plt.ylabel('y')
#plt.xticks(np.linspace(-1, 1, 5))
#plt.yticks(np.linspace(-1, 6, 8))
ax = plt.gca()
ax.spines['right'].set_color('none')
ax.spines['top'].set_color('none')
ax.xaxis.set_ticks_position('bottom')
ax.yaxis.set_ticks_position('left')
ax.spines['bottom'].set_position(('data', 0))
ax.spines['left'].set_position(('data', 0))

# plt.plot(x, y1, label='y1')
# plt.plot(x, y2, label='y2')
# plt.legend()

plt.show()