matlab 曲线 标注,请问关于Matlab曲线标注问题
小弟在做毕业设计,遇到棘手问题,请求高手解答,不胜感激,。。。
程序如下:
a1=[12.7 12.65 78.625 99.836 222.28 309.35 438.04 540.72 728.15 774.75 819.13
20 12.64 78.347 99.257 222.34 308.38 435.48 537.76 727.97 774.31 818.01
24 12.63 78.132 98.856 222.35 307.7 433.93 535.74 727.53 773.86 817.01
28 12.622 78.001 98.205 222.27 306.62 432.75 532.48 727.11 773.17 815.68
32 12.605 77.721 97.671 222.22 305.72 431.45 529.92 725.93 772.18 813.91
38 12.57 77.242 96.765 222.03 304.2 429.98 525.69 723.05 769.88 810.42
44 12.512 76.543 96.029 221.68 302.94 428.83 522.29 717.1 766.11 805.9
48 12.478 76.319 94.97 221.31 301.31 429.25 517.83 714.9 762.69 802.37
60 12.283 75.049 92.294 219.45 297.61 431.72 507.58 700.23 743.97 790.23
];
a2=[38 12.57 77.242 96.765 222.03 304.2 429.98 525.69 723.05 769.88 810.42
40 12.548 77.05 96.814 221.79 304.04 429.63 525.71 721.85 769.29 810.67
46 12.516 76.53 96.06 221.56 303.3 428.12 522.3 719.85 767.11 809.79
50 12.472 75.549 95.709 219.53 302.19 421.51 516.72 704.68 764.79 802.51
58 12.406 75.145 94.991 220.78 302.17 424.88 517.73 712.64 760.16 808.86
60 12.382 74.865 94.822 220.64 302.02 424.27 517.05 711.01 758.55 808.78
66 12.301 73.915 94.327 220.17 301.69 422.23 515.13 705.38 752.65 808.65
70 12.234 73.175 94.018 219.81 301.57 420.72 513.98 700.77 747.6 808.75
];
a3=[38 12.57 77.242 96.765 222.03 304.2 429.98 525.69 723.05 769.88 810.42
40 12.568 77.24 96.612 222.05 303.88 430.06 525.08 722.55 769.45 809.16
46 12.565 77.273 96.142 222.14 302.88 430.47 523.24 721.07 767.99 804.78
50 12.564 77.318 95.826 222.19 302.16 430.84 521.99 720.12 766.84 801.35
58 12.562 77.443 95.2 222.25 300.61 431.69 519.42 718.38 764.1 793.23
60 12.562 77.477 95.051 222.26 300.2 431.91 518.77 717.96 763.31 790.95
66 12.56 77.591 94.602 222.27 298.91 432.59 516.67 716.86 760.72 783.46
70 12.559 77.668 94.318 222.26 297.98 433.03 515.2 716.19 758.78 777.97];
a4=[20 12.606 77.786 99.642 222.16 309.05 433.72 539.46 726.44 772.99 818.61
24 12.586 77.444 99.255 222.03 308.38 432.02 537.25 724.6 771.69 817.41
28 12.56 77.052 98.79 221.79 307.56 430.5 534.62 721.68 769.78 815.68
32 12.527 76.616 98.244 221.41 306.61 429.3 531.57 717.47 767.03 813.37
38 12.46 75.893 97.265 220.48 304.92 428.29 526.28 708.54 760.67 808.75
44 12.367 75.108 96.078 219.01 302.99 428.46 520.27 696.6 750.31 802.88
48 12.287 74.563 95.159 217.64 301.61 429.31 515.96 687.35 740.16 798.41
60 11.919 72.907 91.649 211.11 297.44 435.68 502.6 657.55 683.65 783.65];
a11=a1';
a22=a2';
a33=a3';
a44=a4';
circula=a11(2:11,:);
upright=a22(2:11,:);
parellel=a33(2:11,:);
retangula=a44(2:11,:);
x1=a11(1,:);
x2=a22(1,:);
x3=a33(1,:);
x4=a44(1,:);
x11=12.7:0.1:60;
x22=38:1:70;
x33=38:70;
x44=20:60;
y1=zeros(10,474);
p1=zeros(10,5);
for ii=1:10;
[p1(ii,:),s]=polyfit(x1(1,:),circula(1,:),4);
y1(ii,:)=polyval(p1(ii,:),x11(1,:));
end;
y2=zeros(10,33);
p2=zeros(10,5);
for ii=1:10;
[p2(ii,:),s]=polyfit(x2(1,:),upright(1,:),4);
y2(ii,:)=polyval(p2(ii,:),x22(1,:));
end;
y3=zeros(10,33);
p3=zeros(10,5);
for ii=1:10;
[p3(ii,:),s]=polyfit(x3(1,:),parellel(1,:),4);
y3(ii,:)=polyval(p3(ii,:),x33(1,:));
end;
y4=zeros(10,41);
p4=zeros(10,5);
for ii=1:10;
[p4(ii,:),s]=polyfit(x4(1,:),retangula(1,:),4);
y4(ii,:)=polyval(p4(ii,:),x44(1,:));
end;
plot(x1,circula(1,:),'s',x11,y1(1,:),'r-','LineWidth',2,'MarkerEdgeColor','B','MarkerFaceColor','k');hold on;
plot(x2,upright(1,:),'^',x22,y2(1,:),'B--','LineWidth',2,'MarkerEdgeColor','B','MarkerFaceColor','k');hold on;
plot(x3,parellel(1,:),'d',x33,y3(1,:),'K:','LineWidth',2,'MarkerEdgeColor','B','MarkerFaceColor','k');hold on;
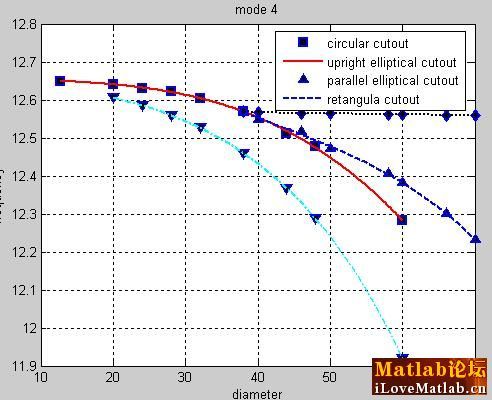
plot(x4,retangula(1,:),'v',x44,y4(1,:),'c-.','LineWidth',2,'MarkerEdgeColor','B','MarkerFaceColor','k'),axis normal,title('mode 4'),Xlabel('diameter'),Ylabel('frequency'),box on,legend('circular cutout','upright elliptical cutout','parallel elliptical cutout','retangula cutout');grid on;
得出图形如图:
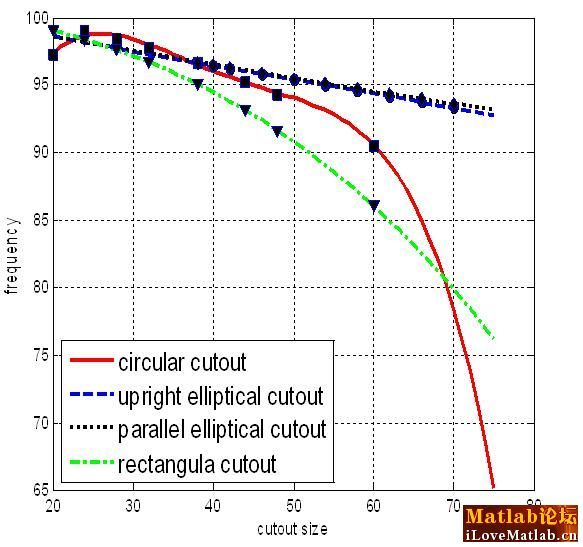
想要得到的图像如图:
即在legend标注栏里只要标注曲线,而不把点的标注标出来。
QQ截图未命名.jpg
(43.84 KB, 下载次数: 10)
2008-5-27 07:07 上传


QQ截图未命名2.jpg
(56.1 KB, 下载次数: 10)
2008-5-27 07:07 上传