Orange 学习3 - Evaluate模块简介-2
目录
5. ROC Analysis
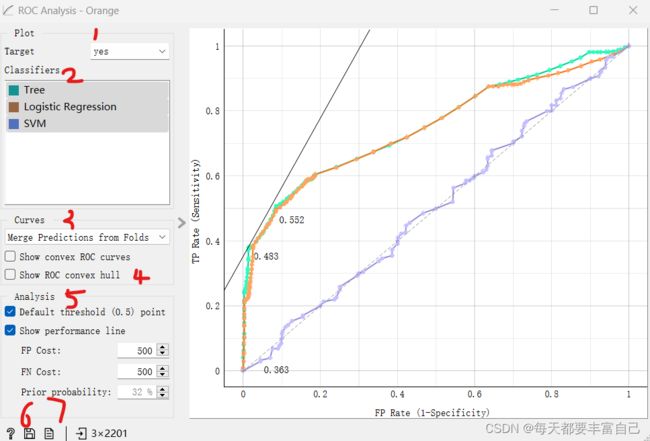
1. 首先选择Target,本例中分为yes 和no
2.选择需要对比的学习器
3. 选择不同的曲线(由于这些数据是多次迭代得到的,所以可以选择不同的数据形式)
4. 点击【Show convex ROC curves】 和【Show ROC convex hull】
5. Analysis
6.保存图片
7. 输出报告
6. Performance curve
7. Calibration Plot
5. ROC Analysis
ROC analysis:Plots a true positive rate against a false positive rate of a test
ROC曲线是以“真正例率(Ture positive rate, 简称TPR)”为纵坐标,横轴为“假正例率(False positive rate,简称FPR)”,两者定义如下:
![]()
![]()
若一个学习器的ROC曲线被另一个学习器的曲线完全包住,则可断言后者的性能优于前者。如两者的ROC曲线有交叉,则需要判断ROC线下的面就,也就是AUC
对某个分类器而言,我们可以根据其在测试样本上的表现得到一个TPR和FPR点对。这样,此分类器就可以映射成ROC平面上的一个点。调整这个分类器分类时候使用的阈值,我们就可以得到一个经过(0, 0),(1, 1)的曲线,这就是此分类器的ROC曲线。一般情况下,这个曲线都应该处于(0, 0)和(1, 1)连线的上方。因为(0, 0)和(1, 1)连线形成的ROC曲线实际上代表的是一个随机分类器。如果很不幸,你得到一个位于此直线下方的分类器的话,一个直观的补救办法就是把所有的预测结果反向,即:分类器输出结果为正类,则最终分类的结果为负类,反之,则为正类。虽然,用ROC curve来表示分类器的performance很直观好用。可是,人们总是希望能有一个数值来标志分类器的好坏。于是Area Under roc Curve(AUC)就出现了。顾名思义,AUC的值就是处于ROC curve下方的那部分面积的大小。通常,AUC的值介于0.5到1.0之间,较大的AUC代表了较好的performance。
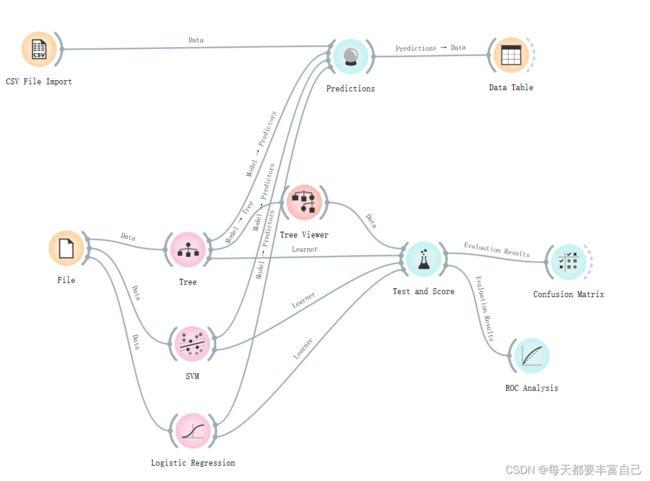
拉入这个【ROC Analysis】模块,如下图所示
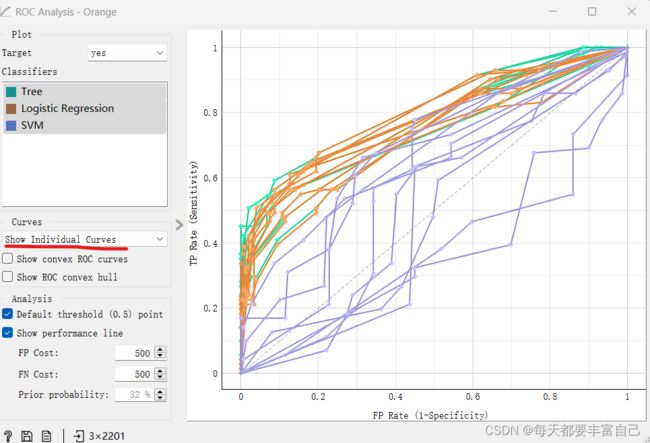
双击【ROC Analysis】模块,如下图所示
1. 首先选择Target,本例中分为yes 和no
2.选择需要对比的学习器
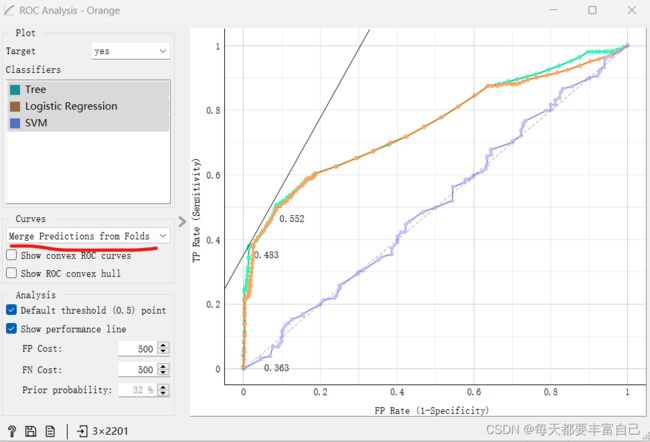
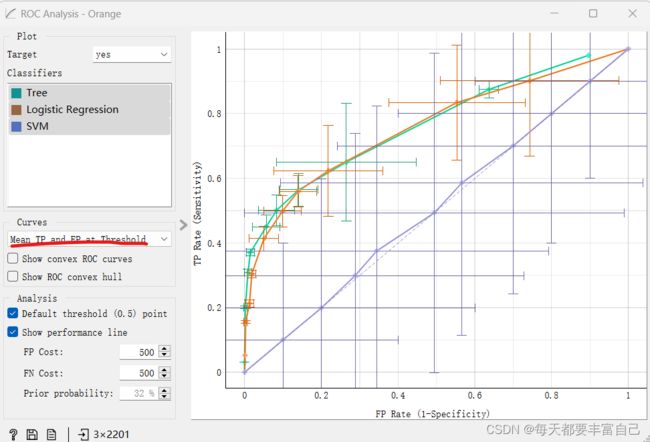
3. 选择不同的曲线(由于这些数据是多次迭代得到的,所以可以选择不同的数据形式)
Merge predictions from folds:所有测试数据视为来自单个迭代
Mean TP rate:垂直平均曲线,显示相应的置信区间
Mean TP and FP at threshold:遍历阈值,平均曲线位置并显示水平和垂直置信区间
Show individual curves:输出所有曲线
4. 点击【Show convex ROC curves】 和【Show ROC convex hull】
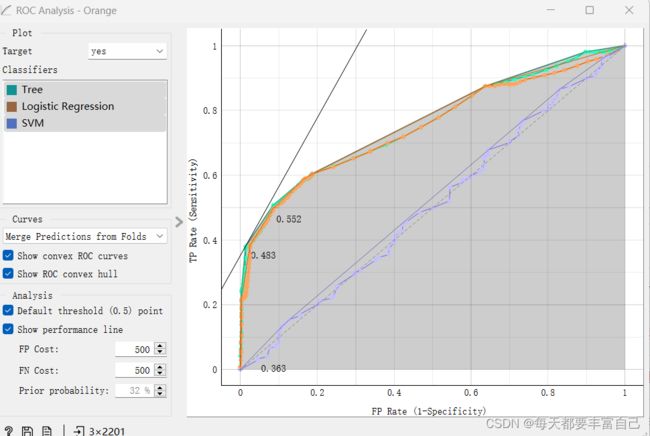
Show convex ROC curves:每个分类器上的凸曲线,如下图中的黑色的细线
Show ROC convex hull:如图中灰色区域
绘制这两种类型的凸曲线是有意义的,因为在曲线的凹部选择阈值不能产生最佳结果,而不考虑成本矩阵。此外,通过组合由凹区域边界上的点表示的分类器,可以到达凸曲线上的任何点。
对角虚线表示随机分类器的行为。完整的对角线代表 iso-performance。图表底部的黑色“A”符号按比例重新调整图表。
5. Analysis
Default threshold (0.5) point shows the point on the ROC curve achieved by the classifier if it predicts the target class if its probability equals or exceeds 0.5. 如果分类器的概率等于或超过 0.5,则显示分类器预测目标类时在 ROC 曲线上实现的点。
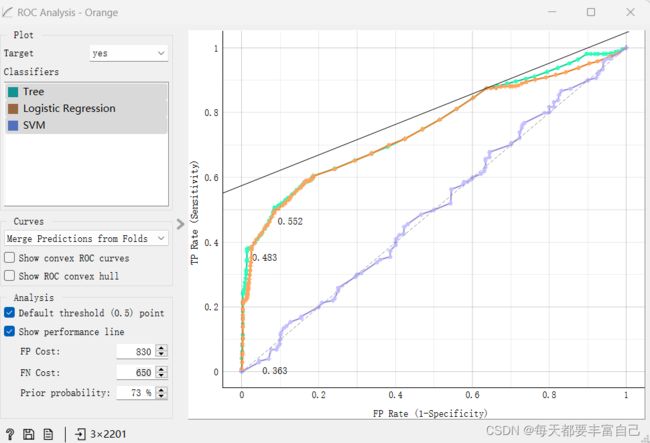
Show performance line shows iso-performance in the ROC space so that all the points on the line give the same profit/loss. The line further to the upper left is better than the one down and right. The direction of the line depends upon costs and probabilities. This gives a recipe for depicting the optimal threshold for the given costs: this is the point where the tangent with the given inclination touches the curve and it is marked in the plot. If we push the iso-performance higher or more to the left, the points on the iso-performance line cannot be reached by the learner. Going down or to the right, decreases the performance. 显示 ROC 空间中的 ISO 性能,以便线上的所有点都给出相同的利润/损失。左上角的线比右上角的线要好。线路的方向取决于成本和概率。这给出了描述给定成本的最佳阈值的配方:这是具有给定倾斜度的切线接触曲线并在图中标记的点。如果我们将iso-performance推得更高或更左,学习者就无法到达iso-performance线上的点。向下或向右移动会降低性能。
该部件允许将成本设置为从 1 到 1000。单位不重要,大小也不重要。重要的是两个成本之间的关系,因此将它们设置为 100 和 200 将给出与 400 和 800 相同的结果。默认值:两个成本相等(500),先前目标类概率为50%(来自数据)
False positive cost: 830, False negative cost 650, Prior target class probability 73%.
6.保存图片
7. 输出报告
6. Performance curve
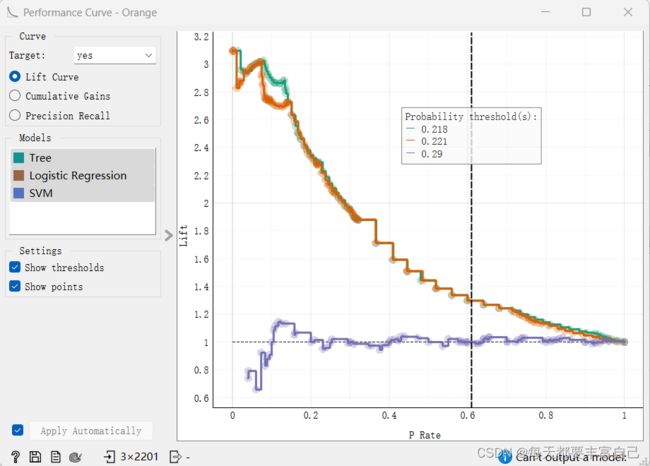
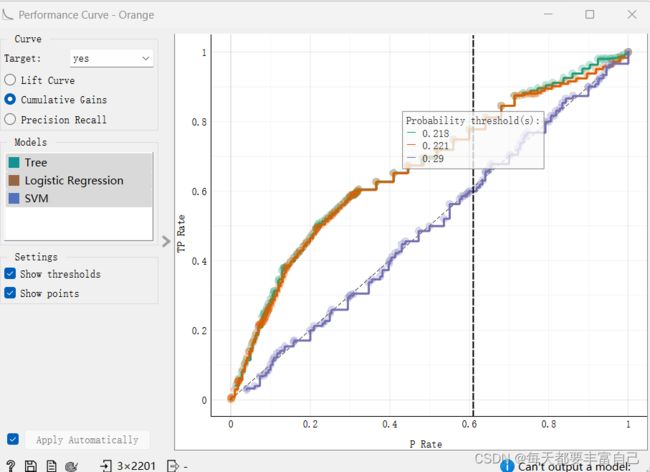
性能曲线(Performance curve)显示了用于分析真正样例相对于分类器阈值的比例或我们归类为正数的实例数的曲线。
Lift Curve: 它衡量的是,与不利用模型相比,模型的预测能力“变好”了多少,lift(提升指数)越大,模型的运行效果越好。实质上它强调的是投入与产出比。
表示“运用该模型”与“未运用该模型即随机选择”所得结果的比值,Lift应该一直大于1,且Lift(提升指数)越大,模型预测效果越好
Cumulative Gains: 显示真正例的比例与正实例数的函数关系
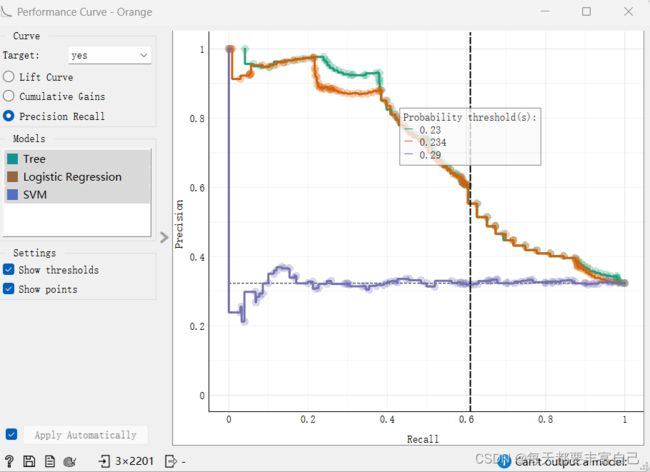
Precision Recall:
P-R曲线刻画查准率和查全率)之间的关系,查准率指的是在所有预测为正例的数据中,真正例所占的比例,查全率是指预测为真正例的数据占所有正例数据的比例。查准率和查全率是一对矛盾的度量,一般来说,查准率高时,查全率往往偏低,查全率高时,查准率往往偏低。
在很多情况下,我们可以根据学习器的预测结果对样例进行排序,排在前面的是学习器认为最可能是正例的样本,排在后面的是学习器认为最不可能是正例的样本,按此顺序逐个把样本作为正例进行预测,则每次可计算当前的查全率和查准率,以查准率为y轴,以查全率为x轴,可以画出下面的P-R曲线。
当PR曲线越靠近右上方时,表明模型性能越好,与ROC曲线类似,在对不同模型进行比较时,若一个模型的PR曲线被另一个模型的PR曲线完全包住则说明后者的性能优于前者。若模型的PR曲线发生了交叉,则无法直接判断哪个模型更好
7. Calibration Plot
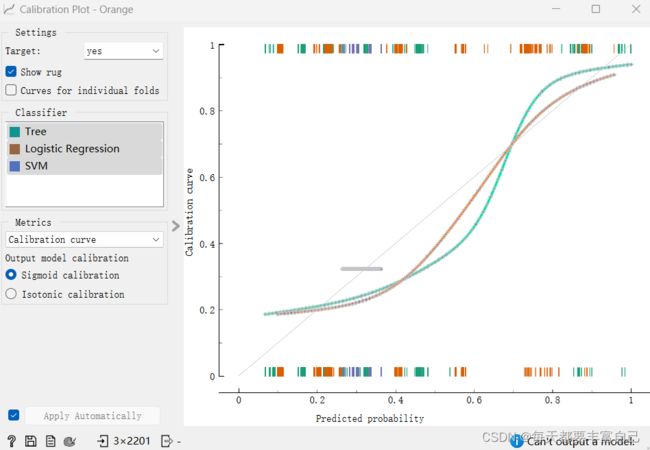
Calibration Plot,将分类器预测的概率与实际类概率进行绘制。我们将使用此部件来查看分类器是过于乐观(给出主要是正面结果)还是悲观(给出主要是负面结果)。该部件还可以输出校准模型,用户在其中设置自己的概率阈值。
- Select the desired target class from the drop down menu.
- Show rug: If enabled, ticks are displayed at the bottom and the top of the graph, which represent negative and positive examples respectively. Their position corresponds to the classifier’s probability prediction. Different colors represent different classifiers. At the bottom of the graph, the points to the left are those which are (correctly) assigned a low probability of the target class, and those to the right are incorrectly assigned high probabilities. At the top of the graph, the instances to the right are correctly assigned high probabilities and vice versa.
- Curves for individual folds: a curve is displayed for each fold from the Test and Score widget.
- Choose which classifiers to plot. Colors in the list of classifiers correspond to colors used in the plot. The diagonal represents optimal behavior when Calibration curve is selected; the closer the classifier’s curve gets, the more accurate its prediction probabilities are.
- Select the metric to calibrate:
- calibration curve: displays calibration curves for multiple models. The options for smoothing functions are Sigmoid or Isotonic function.
- classification accuracy: displays classification accurracy at changing probability thresholds. Threshold can be set by dragging the vertical line left or right.
- F1: displays F1 score at changing probability thresholds. Threshold can be set by dragging the vertical line left or right.
- sensitivity and specificity: displays the relationship between sensitivity and specificity at changing probability thresholds.
- precision and recall: displays the relationship between precision and recall at changing probability thresholds.
- pos and neg predictive value: displays the relationship between positive and negative predictive values at changing probability thresholds.
- true and false positive rate: displays the relationship between TP and FP rate at changing probability thresholds.
- If Apply Automatically is ticked, changes are communicated automatically. Alternatively, click Apply.
When the widget shows the calibration curve, it outputs a calibrated model, whose predicted probabilities are tuned to better match the actual probabilities.
When showing other curves (such as F1), the widget outputs a model that gives the same probabilities, but class predictions are made at thresholds different from 0.5. For instance, if we drag the vertical line shown in the graph to 0.3, the widget outputs a model that predicts a positive class when its probability exceeds 30%.
The widget cannot output a model if the input data contains models obtained from multiple runs (for instance from cross validation or repeated sampling). If multiple models and on the input, only a single one must be chosen in order to have it on the output. The widget also cannot output calibrated model for non-binary classes.
