案例带你学python——matplotlib基础作图
案例带你学matplotlib基础作图
线图
import matplotlib.pyplot as plt
import numpy as np
plt.style.use('seaborn-whitegrid')
# 风格都有哪些?
#输入print(plt.style.available)
#输出:['bmh', 'classic', 'dark_background', 'fast', 'fivethirtyeight', 'ggplot', 'grayscale', 'seaborn-bright', 'seaborn-colorblind', 'seaborn-dark-palette', 'seaborn-dark', 'seaborn-darkgrid', 'seaborn-deep', 'seaborn-muted', 'seaborn-notebook', 'seaborn-paper', 'seaborn-pastel', 'seaborn-poster', 'seaborn-talk', 'seaborn-ticks', 'seaborn-white', 'seaborn-whitegrid', 'seaborn', 'Solarize_Light2', 'tableau-colorblind10', '_classic_test']
fig=plt.figure()
ax= plt.axes()
x = np.linspace(0,10,100)
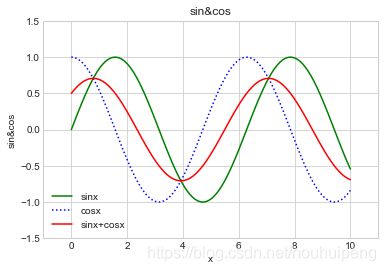
ax.plot(x,np.sin(x),'-g',label='sinx') #实线绿色,label就是要添加图例legend
ax.plot(x,np.cos(x),':b',label='cosx') #虚线蓝色
ax.plot(x,0.5*(np.sin(x)+np.cos(x)),'-r',label='sinx+cosx')
#可用的颜色还有:green,blue,gray,red...
#还要画几条曲线就继续加上去
plt.axis([-1, 11, -1.5, 1.5]) #依次设置坐标轴范围xmin,xmax,ymin,ymax
plt.title('sin&cos')
plt.xlabel("x")
plt.ylabel("sin&cos")
plt.legend() #添加图例
散点图(scatter plot)
用plot做散点图
x = np.linspace(0, 10, 30)
y = np.sin(x)
plt.plot(x, y, 'o', color='black')
#第三个参数表明了要做散点图,不是每一个字母都可以用作样式,scatter plot['o', '.', ',', 'x', '+', 'v', '^', '<', '>', 's', 'd']
# 同一个函数既可以做线图,也可以做散点图,也可以同时都做出来
plt.plot(x,np.cos(x),':ok',color='red')
展示散点样式
rng = np.random.RandomState(0)
for marker in ['o', '.', ',', 'x', '+', 'v', '^', '<', '>', 's', 'd']:
    plt.plot(rng.rand(1), rng.rand(1), marker,
    label="marker='{0}'".format(marker))
    plt.legend()
plt.xlim(0,1.2)

用scatter做散点图
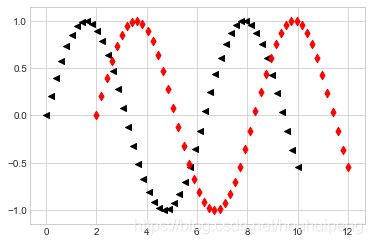
x=np.linspace(0,10,50)
y=np.sin(x)

plt.scatter(x,y,marker='<',color='black')
plt.scatter(x+2,y,marker='d',color='red')
本文翻译整理自:《Python Data Science Handbook》