单细胞测序数据分析——细胞通讯 CellChat
一、CellChat介绍
特别好的文章:CellChat细胞通讯分析(上)--文献解读 - 知乎 (zhihu.com)![]() https://zhuanlan.zhihu.com/p/525115168
https://zhuanlan.zhihu.com/p/525115168
CellChat细胞通讯分析(中)--实操代码(单个样本) - 知乎 (zhihu.com)![]() https://zhuanlan.zhihu.com/p/525365897
https://zhuanlan.zhihu.com/p/525365897
基本流程:
cellchat的导入的数据分为两个部分:标准化的矩阵data和细胞分组信息mata,data储存的是基因表达数据,行名是基因,列名是细胞。meta储存的是细胞标签,行名是细胞名 ,记住这个信息,可以方便于分析的时候取子集。
二、基本流程
(一)创建cellchat对象
#首先得清空环境
rm(list = ls())
setwd("")
BiocManager::install("sqjin/CellChat")#下载cellchat,可能需要在R里进行,不太好下载
library(CellChat)
library(patchwork)
library(ggalluvial)
library(igraph)
library(dplyr)
#需要安装rtools才能运行
options(stringsAsFactors = FALSE) #输入数据不自动转换成因子(防止数据格式错误)
options(futrue.globlas.Maxsize=2*1024**3)
#设置硬件参数,8线程
suppressWarnings(suppressMessages(future::plan("multiprocess", workers = 8)))
1.数据下载和读取
#下载数据
#win+r wmic cpu get numberOfLogicalProcessors
#load(url("https://ndownloader.figshare.com/files/25950872"))#读取示例数据集
#View(data_humanSkin)
#saveRDS(data_humanSkin,'data_humanSkin.rds')
#读取数据,这个数据必须要由两个部分组成,1.标准化的矩阵data.2.细胞分组信息meta
data_humanSkin <- readRDS('data_humanSkin.rds')
class(data_humanSkin)
## [1] "list"
#示例数据:来源于人类皮肤
#作者发表文献 #https://www.nature.com/articles/s41467-021-21246-9.pdf
2.取子集进行分析
data.input <- data_humanSkin$data # normalized data matrix
meta <- data_humanSkin$meta # a dataframe with rownames containing cell mata data
unique(meta$condition)
## [1] "LS" "NL"
cell.use <- rownames(meta)[meta$condition == "LS"] # 按指定的变量提取细胞
data.input <- data.input[, cell.use]#取出对应细胞,也就是说,data的列名是meta的行名
meta = meta[cell.use, ]#取出对应细胞的meta信息
unique(meta$labels)#看meta中储存的细胞注释信息,稍后用它作为分组依据
3.创建cellchat对象
cellchat <- createCellChat(object = data.input, meta = meta, group.by = "labels")
#创建celllchat对象,group.by指定通讯间的对象,用meta中的注释作为分组依据
cellchat <- addMeta(cellchat, meta = meta)
cellchat <- setIdent(cellchat, ident.use = "labels") # set "labels" as default cell identity
groupSize <- as.numeric(table(cellchat@idents)) #每种细胞的细胞数量
4.查看CellChatDB的组成,设置参考数据库
# 选择合适的物种,可选CellChatDB.human, CellChatDB.mouse
CellChatDB <- CellChatDB.human
#查看数据库的组成比例
showDatabaseCategory(CellChatDB)
# 查看数据库具体信息
CellChatDB$interaction[1:4,1:4]
head(CellChatDB$cofactor)
head(CellChatDB$complex)
head(CellChatDB$geneInfo)
CellChatDB.use <- subsetDB(CellChatDB, search = "Secreted Signaling")#取出相应分类用作分析数据库
cellchat@DB <- CellChatDB.use#将数据库内容载入cellchat对象中,相当于设置好接下来要参考的数据库
5.表达数据预处理
cellchat <- subsetData(cellchat)#取出表达数据
cellchat <- identifyOverExpressedGenes(cellchat)#寻找高表达的基因#
cellchat <- identifyOverExpressedInteractions(cellchat)#寻找高表达的通路
cellchat <- projectData(cellchat, PPI.human)#投影到PPI,储存上一步的结果到cellchat@LR$LRsig
(二)推断配受体通讯网络
1.在配受体水平上计算细胞通讯
#计算细胞与细胞之间通信的概率
cellchat <- computeCommunProb(cellchat, raw.use = T)#默认计算方式为#type = "truncatedMean",
##去掉通讯数量很少的细胞,默认cutoff的值为20%,即表达比例在25%以下的基因会被认为是0, trim = 0.1可以调整比例阈值
cellchat <- filterCommunication(cellchat, min.cells = 10)

#将推断的结果提取出来
df.net <- subsetCommunication(cellchat)#将细胞通讯预测结果以数据框的形式取出
#install.packages("DT"),DT就是展示数据框的一种工具,可以调节展示的参数等
library(DT)
DT::datatable(df.net)
write.csv(df.net,'01.df.net.csv')
2.在细胞通路水平上计算细胞间通讯,CellChat通过汇总与每个信号通路相关的所有配体-受体相互作用的通信概率来计算信号通路水平的通信概率。
#计算信号通路水平上的细胞间通讯,通过汇总与每个信号通路相关的所有配体-受体相互作用的通信概率来计算信号通路水平的通信概率
cellchat <- computeCommunProbPathway(cellchat)
3.计算聚合的细胞间通讯网络。我们可以通过计算链路的数量或汇总通信概率来计算聚合的细胞通信网络。用户还可以通过设置 sources.use和 targets.use来计算细胞组子集之间的聚合网络,使用circle plot显示任意两个细胞组之间的交互次数或总交互强度(权重)
cellchat <- aggregateNet(cellchat)#计算细胞-细胞聚合通信网络
groupSize <- as.numeric(table(cellchat@idents))
groupSize
#组图,1行3列
par(mfrow = c(1,3), xpd=TRUE)
#使用圆图显示任意两个细胞群之间的相互作用数量或总相互作用强度(权重)。颜色和source是一致的,圈圈的大小是每个细胞群细胞的数量
netVisual_circle(cellchat@net$count, vertex.weight = groupSize, weight.scale = T,
                 label.edge= F, title.name = "Number of interactions")
#总相互作用强度
netVisual_circle(cellchat@net$weight, vertex.weight = groupSize, weight.scale = T,
                 label.edge= F, title.name = "Interaction weights/strength")
#以cDC2为中心的相互作用强度
netVisual_circle(cellchat@net$weight, vertex.weight = groupSize, weight.scale = T,
                 label.edge= F, title.name = "Interaction weights/strength",
                 targets.use = 'cDC2')
#检查每种细胞和其他细胞的互作情况
mat <- cellchat@net$weight
par(mfrow = c(3,4), xpd=TRUE)
for (i in 1:nrow(mat)) {#
mat2 <- matrix(0, nrow = nrow(mat), ncol = ncol(mat), dimnames = dimnames(mat))
mat2[i, ] <- mat[i, ]
netVisual_circle(mat2, vertex.weight = groupSize, weight.scale = T,
edge.weight.max = max(mat), title.name = rownames(mat)[i])
(三)细胞间通讯网络的可视化
1.可视化每个信号通路网络
pathways.show <- df.net$pathway_name#计算到的所有通路
#如果要选择其中一个信号的话,pathways.show <- c("TGFb")
(1)层次图可视化信号通路
左侧部分显示对某些感兴趣的细胞(即定义的vertex.receiver)的自分泌和旁分泌信号,右侧部分显示对数据集中剩余细胞的自分泌和旁分泌信号,在层次图中,实心圆和空心圆分别代表源和目标。
用户应定义vertex.receiver,这是一个数值向量,代表的是感兴趣的细胞类型,比如(1,4)是指在Hierarchy plot中,左侧的感兴趣的细胞群的信号传导,这些感兴趣的细胞群是cellchat@idents里细胞的前四种,也就是df.net里target的前4种。
vertex.receiver = seq(1,4)
netVisual_aggregate(cellchat, signaling =pathways.show[1],
vertex.receiver = vertex.receiver,layout = 'hierarchy')(2)圈图 边缘颜色与信号发出源一致,边缘权重与交互强度成正比。较粗的边缘线表示较强的信号。在Hierarchy plot 和 Circle plot中,圆圈大小与每个细胞类群中的细胞数成正比。
(3)和弦图 CellChatt提供两种功能netVisual_chord_cell, netVisual_chord_gene用于可视化具有不同目的和不同级别的细胞间通信。netVisual_chord_cell 用于可视化不同细胞群间细胞与细胞通讯(和弦图每个扇区都是一个细胞类群),net_Visual_chord_gene用于可视化由多个配受体或信号通路介导的细胞通讯
# Circle plot
netVisual_aggregate(cellchat, signaling = pathways.show[1], layout = "circle")

netVisual_aggregate(cellchat, signaling = pathways.show[1], layout = "chord")
(4)热图,一组热图只能展示一种信号通路
#热图
par(mfrow=c(1,1))
netVisual_heatmap(cellchat, signaling = pathways.show[1], color.heatmap = "Reds")
2.可视化单个配受体做出的贡献
#配受体展示,以柱状图的形式
p1 <- netAnalysis_contribution(cellchat, signaling = pathways.show[1],
                               title =  pathways.show[1])#展现对特定通路的贡献程度
p2 <- netAnalysis_contribution(cellchat, signaling = pathways.show)#展示所有通路的贡献程度
cowplot::plot_grid(p1, p2, align = "h",ncol=2)
#指定通路画连线图,pathway.show[1]是指对pathway.show里的第一种信号通路:FGF信号通路的配受体进行分析
3.可视化起显著性作用的配受体
#提取pathway.show里的第一种信号通路:FGF信号通路的起显著性作用的配受体进行分析
pairLR.CXCL <- extractEnrichedLR(cellchat, signaling = pathways.show[1],
                                 geneLR.return = FALSE)#提取显著作用的配受体对
LR.show <- pairLR.CXCL[1,] # show one ligand-receptor pair
vertex.receiver = seq(1,4) # a numeric vector
#signaling = pathways.show在所有的信号通路中,pairLR.use = LR.show,FGF信号通路的起显著性作用的配受体的第一对FGF7_FGFR1.
#vertex.receiver = seq(1,4) 感兴趣的配体所在的细胞类型是前4种。layout = 'hierarchy'以Hierarchy plot的形式导出。
p3<-netVisual_individual(cellchat, signaling = pathways.show,
                         pairLR.use = LR.show, vertex.receiver = vertex.receiver,
                         layout = 'chord')
#差不多的意思,在前7种细胞类型中查看。
vertex.receiver = seq(1,7) # a numeric vector

p4<-netVisual_individual(cellchat, signaling = pathways.show,
                         pairLR.use = LR.show, vertex.receiver = vertex.receiver,
layout = 'circle')4.可视化多个配受体介导的细胞通讯
(1)气泡图
#以气泡图的形式表示,sources.use = 4感兴趣的细胞是第4种类型"Inflam. FIB",靶向细胞是第5到第11种类型。
#作图出来的横坐标是sources细胞和靶向细胞的组合。纵坐标是配受体的组合。颜色深浅代表作用强度,大小代表显著性水平。
p1 <- netVisual_bubble(cellchat, sources.use = 4,
                       targets.use = c(5:11), remove.isolate = FALSE)
## Comparing communications on a single object
p2 <- netVisual_bubble(cellchat, sources.use = 4,
                       targets.use = c("cDC1","cDC2","LC","Inflam. DC","TC","Inflam. TC",
                                       "CD40LG+ TC"), remove.isolate = FALSE)
## Comparing communications on a single object
p3 <-netVisual_bubble(cellchat, sources.use = 4,
                      targets.use = c("cDC1","cDC2"), remove.isolate = FALSE)
## Comparing communications on a single object
#指定信号通路
p4 <-netVisual_bubble(cellchat, sources.use = 4,
                      targets.use = c(5:11), signaling = c("CCL","CXCL"),
                      remove.isolate = FALSE)
## Comparing communications on a single object
cowplot::plot_grid(p1, p2,p3, align = "h",ncol=4)
#指定信号通路提取配受体
par(mfrow = c(1,3), xpd=TRUE)
#提取在"CCL","CXCL","FGF"信号通路中富集的配体
pairLR.use <- extractEnrichedLR(cellchat, signaling = c("CCL","CXCL","FGF"))
pairLR.use
##   interaction_name
## 1       CCL19_CCR7
## 2     CXCL12_CXCR4
## 3     CXCL12_ACKR3
## 4       FGF7_FGFR1

#气泡图,sources.use = c(3,4)感兴趣的细胞类型是第3个和第4个,targets.use = c(5:8)靶向的细胞是第5到8个。
#pairLR.use = pairLR.use感兴趣的配体
p1 <-netVisual_bubble(cellchat, sources.use = c(3,4), targets.use = c(5:8),
                      pairLR.use = pairLR.use, remove.isolate = TRUE)
## Comparing communications on a single object
p2 <-netVisual_bubble(cellchat, sources.use = 4, targets.use = c(5:11),
                      signaling = c("CCL","CXCL"), remove.isolate = FALSE)
## Comparing communications on a single object
p3 <-netVisual_bubble(cellchat, sources.use = 4, targets.use = c(5:11),
                      signaling = c("CCL","CXCL"), remove.isolate = T)
## Comparing communications on a single object
cowplot::plot_grid(p1, p2,p3, align = "h",ncol=3)
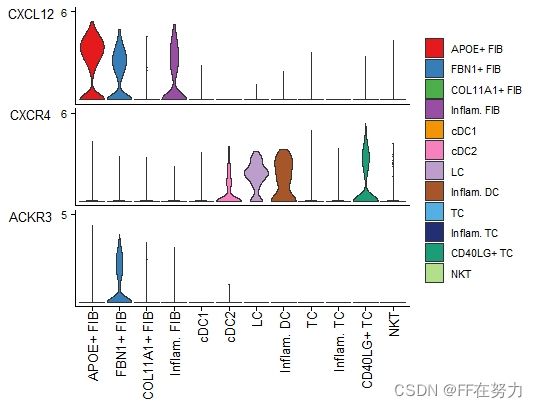
(2)小提琴图
利用plotGeneExpression绘制与 LR 对或信号通路相关的信号基因的基因表达分布
plotGeneExpression(cellchat, signaling = "CXCL")
默认情况下,plotGeneExpression仅显示与推断的重要通信相关的信号基因的表达。用户可以通过以下方式显示与一个信号通路相关的所有信号基因的表达。
plotGeneExpression(cellchat, signaling = "CXCL", enriched.only = FALSE)(3) 散点图
使用散点图在 2D 空间中可视化主要的发送者(源)和接收者(目标)
#首先计算和可视化网络中心性评分
cellchat <- netAnalysis_computeCentrality(cellchat, slot.name = "netP") # the slot 'netP' means the inferred intercellular communication network of signaling pathways
# Visualize the computed centrality scores using heatmap, allowing ready identification of major signaling roles of cell groups
netAnalysis_signalingRole_network(cellchat, signaling = pathways.show, width = 8, height = 2.5, font.size = 10)
gg1 <- netAnalysis_signalingRole_scatter(cellchat)
gg2 <- netAnalysis_signalingRole_scatter(cellchat, signaling = c("CXCL", "CCL"))
gg1 + gg2
报错记录:
Error: not enough space for cells at track index '1'.不用慌,清理一下“PLOTS”板块就可以了,是没有足够的空间出图了
Error in grid.Call(C_convert, x, as.integer(whatfrom), as.integer(whatto),  :
  Viewport has zero dimension(s)
没有足够的空间出图,把PLOTS框拉大就好了


