python matplotlib 绘制热图(极简)
代码
import matplotlib.pyplot as plt
from matplotlib import cm

def Hotmap():

    datas=[[1,2,3],[4,5,6],[7,8,9]]#热图数据(可根据需要修改)
    x_tick=['a','b','c']#横坐标(可根据需要修改)
    y_tick=['A','B','C']#纵坐标

    ax=plt.subplot()
    im=ax.imshow(datas,cmap=cm.binary)#绘制 可通过更改cmap改变颜色
    ax.set_xticks(np.arange(len(x_tick)), labels=x_tick)#设置标签
    ax.set_yticks(np.arange(len(y_tick)), labels=y_tick)
    #np.arrange产生的数组是标签的位置如果热图为400*400矩阵则[100,200,300,400]就是对应的位置,据此可以随意划分热图并根据需要产生间隔
  	#如ax.set_yticks(np.arange(0,300,100), labels=y_tick)即把'A','B','C'放在0,100,200位置处
    plt.colorbar(im)#添加颜色条
    plt.show()#显示

def main():
	Hotmap()
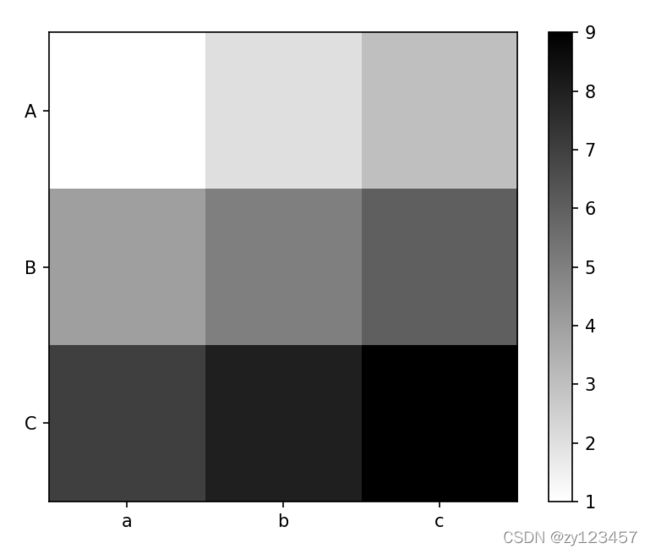
效果
补充
cmap内置参数
上图选用的为 cm.binary
1)Accent, Blues, BrBG, BuGn, BuPu, CMRmap, Dark2, GnBu, Greens, Greys, OrRd, Oranges, PRGn, Paired, Pastel1, Pastel2, PiYG, PuBu, PuBuGn, PuOr, PuRd, Purples, RdBu RdGy, RdPu, RdYlBu, RdYlGn, Reds, Set1, Set2, Set3, Spectral, Wistia, YlGn, YlGnBu, YlOrBr, YlOrRd
2)afmhot, autumn, binary, bone, brg bwr, cividis, cool, coolwarm, copper, cubehelix, flag, gist_earth, gist_gray, gist_heat, gist_ncar gist_rainbow, gist_stern, gist_yarg, gnuplot, gnuplot2, gray, hot, hsv, inferno, jet, magma, nipy_spectral, ocean, pink, plasma, prism, rainbow, seismic, spring, summer, tab10, tab20, tab20b, tab20c, terrain, twilight, twilight_shifted, viridis, winter
具体颜色可参考
matplotlib.pyplot——cmap直观理解
