信号与系统(3)---男生、女生声音信号的混合与分离
本博文是信号与系统系列博文的最后一篇,主要针对于“男生、女生声音信号的混合与分离”展开研究。信号与系统系列主要包含三篇博文,基于自己三个不同研究目标的信号与系统实验,欢迎阅读信号与系统系列全部博文。
文章目录
- 前言
- 一、声音信号混合
-
-
-
-
- 一、声音信号混合函数
- 2、声音信号混合可视化分析
-
-
-
- 二、声音信号分离
-
- 1.低通滤波器设计
- 2.男女声音分离及可视化分析
- 总结
前言
本博文研究点基于“男生、女生声音信号的混合与分离”,声音的混合与分离是信号处理领域非常重要的研究问题之一,本实验基于男生、女生声音混合,该问题可视为噪声与原声音混合与分离实验的具体应用,在当代科学研究和生活生产中均具有比较广泛的应用。一、声音信号混合
声音信号的混合是将两段不同的音频的信号混合在一起,在本实验中,采用自构函数的方式来实现声音信号的混合,借助于该函数即可完成两段声音信号的混合。一、声音信号混合函数
代码示例:
function [Voice,Fs]=VoiceMix(FileName1,FileName2)

% 注释:
% Input---
% FileName1 FileName2 为混合的两个原声音文件
% Output---
% Voice   混合后的音频时域信号
% Fs      混合后的音频时域信号采样频率

[y,Fs] = audioread(FileName1);
[y2,Fs2] = audioread(FileName2);

% 音频信号可能是多通道的,统一只取一个通道
ft = y(:,1);
ft2=y2(:,1);

% 两个混合音频文件变换为同频率
% resample函数对信号频率进行调整
y3=resample(ft2,Fs,Fs2);

Length=length(y(:,1));
Length2=length(y3(:,1));

if Length>=Length2
    % 随机取得一个长度,将短的音频插入到长的音频中去
    Start=floor(rand*abs(Length-Length2));
    % 音频混合
    Voice=y;
    Voice(Start+1:Start+Length2)=y3+ft(Start+1:Start+Length2);
else
    % 随机取得一个长度,将短的音频插入到长的音频中去
    Start=floor(rand*abs(Length2-Length));
    % 音频混合
    Voice=y3;
    Voice(Start+1:Start+Length)=ft+y3(Start+1:Start+Length);
end
2、声音信号混合可视化分析
代码展示:
function main()
clear;clc;
[voice,Fs]=VoiceMix('data_record.wav','女生.mp3'); % 男生、女生声音信号混合
sound(voice, Fs) % 混合后声音文件播放
pause(5)


% 混合后声音信号的时频域波形
figure(1)
voice = voice(:,1);
voice = voice';
N = length(voice);
t = (0:N-1)/Fs;
y = fft(voice);
f = Fs/N*(0:round(N/2)-1);
subplot(211);
plot(t,voice,'g');%绘制时域波形
xlabel('Time/s');ylabel('Amplitude');
title('信号的波形');
grid;
subplot(212);
plot(f,abs(y(1:round(N/2))));
xlabel('Frequency/Hz');ylabel('Amplitude');
title('信号的频谱');
grid;

% 混合前两段声音信号的时频域波形
figure(3)
[x,Fs]=audioread('data_record.wav');
disp(Fs)
x = x(:,1);
x = x';
N = length(x);
t = (0:N-1)/Fs;
y = fft(x);
f = Fs/N*(0:round(N/2)-1);
subplot(211);
plot(t,x,'g');
xlabel('Time/s');ylabel('Amplitude');
title('信号的波形');
grid;
hold on
subplot(212);
plot(f,abs(y(1:round(N/2))));
xlabel('Frequency/Hz');ylabel('Amplitude');
title('信号的频谱');
grid;
hold on

[x,Fs]=audioread('女生.mp3');
disp(Fs)
x = x(:,1);
x = x';
N = length(x);
t = (0:N-1)/Fs;
y = fft(x);
f = Fs/N*(0:round(N/2)-1);
subplot(211);
plot(t,x,'g');
xlabel('Time/s');ylabel('Amplitude');
title('信号的波形');
grid;
subplot(212);
plot(f,abs(y(1:round(N/2))));
xlabel('Frequency/Hz');ylabel('Amplitude');
title('信号的频谱');
grid;
可视化图形分析:
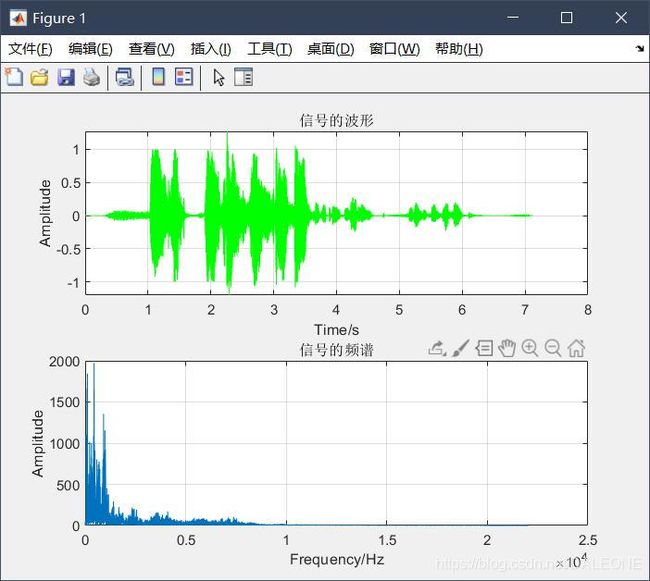
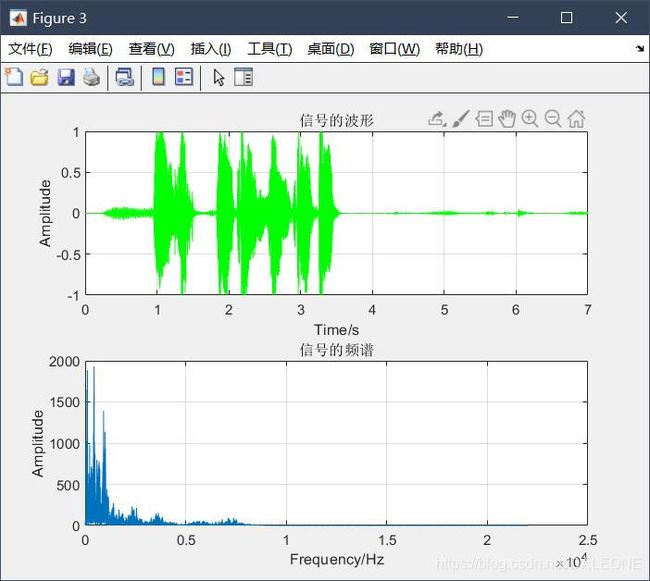
通过上述两幅时频域波形对比,明显可以观察出声音信号混合函数较好地完成两段声音信号混合地操作,图二中蓝色和红色波形地叠加恰好可以得出图一中混合后声音信号的波形。
二、声音信号分离
1.低通滤波器设计
代码如下(示例):
function Hd = Filter_FIR
%FILTER_FIR Returns a discrete-time filter object.

% MATLAB Code
% Generated by MATLAB(R) 9.7 and Signal Processing Toolbox 8.3.
% Generated on: 22-Jun-2021 12:52:59

% Equiripple Lowpass filter designed using the FIRPM function.

% All frequency values are in Hz.
Fs = 44100;  % Sampling Frequency

Fpass = 150;             % Passband Frequency
Fstop = 200;             % Stopband Frequency
Dpass = 0.057501127785;  % Passband Ripple
Dstop = 0.0001;          % Stopband Attenuation
dens  = 20;              % Density Factor

% Calculate the order from the parameters using FIRPMORD.
[N, Fo, Ao, W] = firpmord([Fpass, Fstop]/(Fs/2), [1 0], [Dpass, Dstop]);

% Calculate the coefficients using the FIRPM function.
b  = firpm(N, Fo, Ao, W, {dens});
Hd = dfilt.dffir(b);

% [EOF]
本实验中借助matlab中的Filter Designer进行滤波器设计,Fstop = 200Hz;Fpass = 150Hz,通过此频率设计即可从混合声音信号中将男生声音分离出来。
2.男女声音分离及可视化分析
代码如下(示例):
% 利用上步中设计好的滤波器进行声音信号的提取
voice1 = filter(Filter_FIR,voice)

% 声音信号分离可视化代码分析
sound(voice1,Fs)
N = length(voice1);
t = (0:N-1)/Fs;
y = fft(voice1);
f = Fs/N*(0:round(N/2)-1);
subplot(211);
plot(t,voice1,'g');
xlabel('Time/s');ylabel('Amplitude');
title('信号的波形');
grid;
subplot(212);
plot(f,abs(y(1:round(N/2))));
xlabel('Frequency/Hz');ylabel('Amplitude');
title('信号的频谱');
grid;
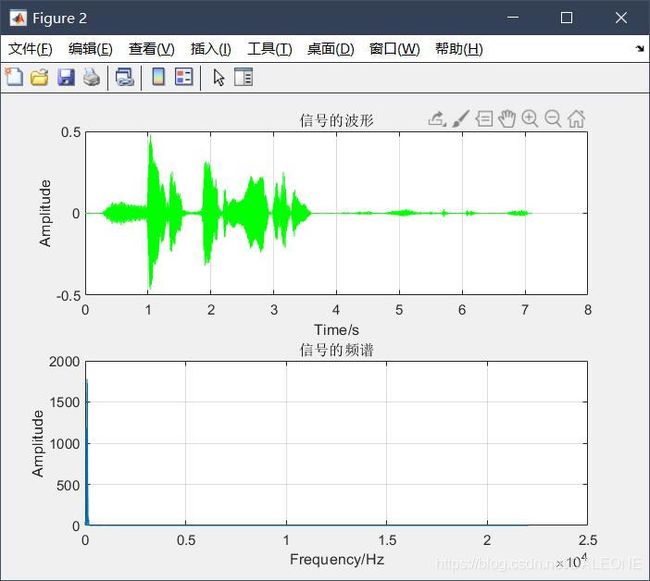
根据上述的时频域分析以及声音混合及分离录音文件的分析,采用自行设计的简易滤波器进行声音信号的分离时,可以在一定程度上将部分信号分离出来。
在本实验中,针对于男生声音信号的分离,无论是从时频域分析的角度抑或是从录制声音文件的角度,均可得到自行设计的滤波器可以较大程度保留声音信号(男生声音信号主体得到保留),但同时也会丢失部分声音信息,导致声音文件音质浑浊不不清等等。
究其原因,主要从低通滤波器频率设计入手,首先便是男生、女生声音频率范围较大,无法具体确定频率的分界线,因此设计频率时可能会存在不合理,不恰当的现象;另外是男生、女生发声频率并非完全独立的,频率之间存在交叠,导致无法找到特定的频率完美的完成声音信号分离的任务。
总结
做个简单的总结:本博文属于信号与系统系列博文的最后一篇,也是其中难度较大的一篇,博文中诸多细节由于自己目前正处于学习阶段,无法详细阐述,后续会进行相应的补充。博文依据于自己的课程设计,如有偏跛,敬请指正,也欢迎大家积极交流,共同进步。
项目已上传至GitHub,GitHub地址:
https://github.com/booue/signals-processing


