轮廓系数silhouette_score手动实现及使用总结
参考博客
https://vitalflux.com/kmeans-silhouette-score-explained-with-python-example/
https://towardsdatascience.com/silhouette-coefficient-validating-clustering-techniques-e976bb81d10c
https://stackoverflow.com/questions/23387275/how-do-you-manually-compute-for-silhouette-cohesion-and-separation-of-cluster
https://blog.csdn.net/maple05/article/details/110454075
使用案例1
from sklearn import datasets
from sklearn.cluster import KMeans
from sklearn.metrics import silhouette_score
#
# Load IRIS dataset
#
iris = datasets.load_iris()
X = iris.data
y = iris.target
#
# Instantiate the KMeans models
#
km = KMeans(n_clusters=3, random_state=42)
#
# Fit the KMeans model
#
km.fit_predict(X)
#
# Calculate Silhoutte Score
#
score = silhouette_score(X, km.labels_, metric='euclidean')
#
# Print the score
#
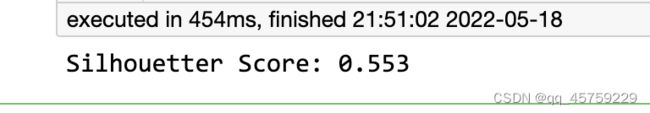
print('Silhouetter Score: %.3f' % score)
结果如下:
 可以对结果进行可视化
from yellowbrick.cluster import SilhouetteVisualizer
import matplotlib.pyplot as plt
fig, ax = plt.subplots(2, 2, figsize=(15,8))
for i in [2, 3, 4, 5]:
    '''
    Create KMeans instance for different number of clusters
    '''
    km = KMeans(n_clusters=i, init='k-means++', n_init=10, max_iter=100, random_state=42)
    q, mod = divmod(i, 2)
    '''
    Create SilhouetteVisualizer instance with KMeans instance
    Fit the visualizer
    '''
    visualizer = SilhouetteVisualizer(km, colors='yellowbrick', ax=ax[q-1][mod])
    visualizer.fit(X)
结果如下

使用2
import pandas as pd
import numpy as np
import seaborn as sns
from sklearn.cluster import KMeans
from sklearn.metrics import silhouette_score
%matplotlib inline
X= np.random.rand(50,2)
Y= 2 + np.random.rand(50,2)
Z= np.concatenate((X,Y))
Z=pd.DataFrame(Z) #converting into data frame for ease
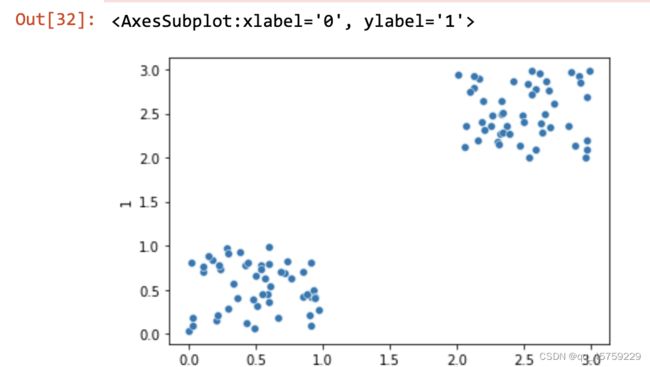
sns.scatterplot(Z[0],Z[1])
结果如图
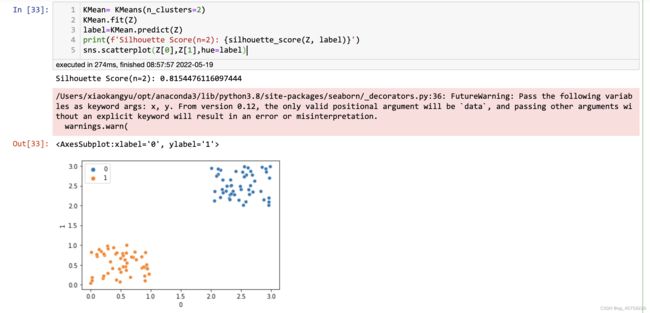
KMean= KMeans(n_clusters=2)
KMean.fit(Z)
label=KMean.predict(Z)
print(f'Silhouette Score(n=2): {silhouette_score(Z, label)}')
sns.scatterplot(Z[0],Z[1],hue=label)
结果如下
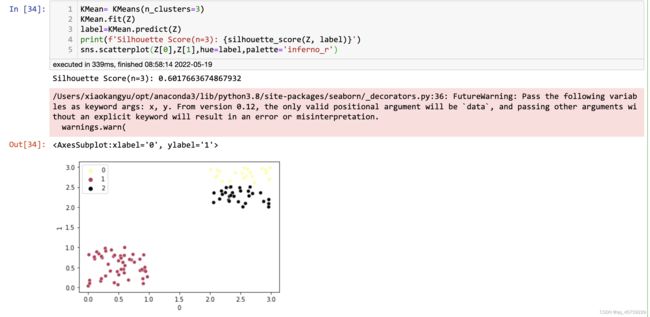
KMean= KMeans(n_clusters=3)
KMean.fit(Z)
label=KMean.predict(Z)
print(f'Silhouette Score(n=3): {silhouette_score(Z, label)}')
sns.scatterplot(Z[0],Z[1],hue=label,palette='inferno_r')
结果如下
 看到网上都是说理论的计算方式,还是自己实现一下理解的比较深
自己实现
#!/usr/bin/env python3
# -*- coding: utf-8 -*-
"""
Created on Thu May 19 08:22:08 2022
@author: xiaokangyu
"""
import pandas as pd
import numpy as np
import seaborn as sns
from sklearn.cluster import KMeans
from sklearn.metrics import silhouette_score
import matplotlib.pyplot as plt
import random
from sklearn.metrics import pairwise_distances
#np.random.seed(1)
#random.seed(1)
n_sample=50
n_feature=5
n_cluster=3
X= np.random.rand(n_sample,n_feature)
Y=np.random.choice(range(n_cluster),size=n_sample) # random assign cluster label
score = silhouette_score(X, Y, metric='euclidean')
print("sklearn calculate silhouette:",score)
# use dict to store all cluster data and label, so it is easy to code
cluster_dict={}
label_set=np.unique(Y)
for i in label_set:
cluster_dict[i]=X[Y==i,:]
#print(cluster_dict) ##
#
s=0
for i in cluster_dict:
for idx in range(len(cluster_dict[i])): ##
temp=cluster_dict[i][idx].reshape(1,-1) #
temp_a=pairwise_distances(temp,cluster_dict[i]) #same cluster
a=np.sum(temp_a)/(len(cluster_dict[i])-1) # mean
b=np.inf
for j in cluster_dict:
if(j!=i):
temp_b=pairwise_distances(temp,cluster_dict[j]) # not same custer
temp_b=np.sum(temp_b)/len(cluster_dict[j]) #mean
b=min(b,temp_b) #
s_sample=(b-a)/max(a,b)
#print(s_sample) ## each silhouette score
s=s+s_sample
print("==============")
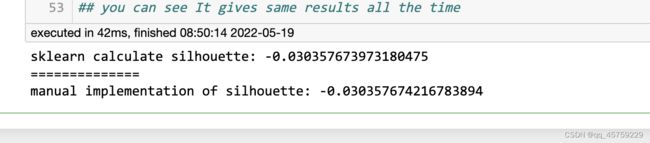
print("manual implementation of silhouette:",s/X.shape[0])
## you can see It gives same results all the time
结果如下