【PyAgrum】学习tutorial的问题和理解总结篇(持续更新)
萌新学PGM中的贝叶斯网络中的PyAgrum库包
文件链接在这:pyAgrum.
文章目录
- 1 Tutorial
-
- 1.1 Water Sprinkler
-
- 1.1.1 "dot" not found in path.
-
- 下载graphviz
- 下载pydot
- 1.1.2 不显示贝叶斯网络的结构图
- 1.1.3 保存bif时显示“Stream states flags are not all unset.”
- 1.1.4 Markov Blanket 和 Minimal conditioning set
- 1.4.1 Markov Blanket
- 1.4.2 Minimal Conditional Set
-
- 例子1
- 例子2
- 1.2 alarm
-
- 1.2.1 gum.loadBN()后找不到该文件
- 1.2.2 需修改的地方
- 2 Example
-
- 2.1 Asthma(目前无问题)
- 2.2 Titanic
-
- 2.2.1 In[17]可优化
- 2.2.2 In[17]的解释 and ROC_PR
- 2.3 Native Credit Default Modeling
-
- 2.3.1 In[20]报错:set_ ticks() got an unexpected keyword argument ' labels'
- 2.4 Causality and learning(别忘了改文件路径,其他无问题)
- 2.5 Sensitivity Analysis Using Credal Networks(暂无问题)
- 2.6 Quasi Continuous(暂无问题)
- 3 Models(目前无问题)
- 4 Learning
-
- 4.1 Structural Learning
-
- 4.1.1 gum has no attributes: generateSample
- 4.1.2 In[10] unrecognized arguments: out/testTypeInduction.csv
- 5 6 7都没有问题
- 8 Tools
-
- 前4个没问题
- 8.5 Colouring And Exporting BNs
-
- 8.5.1 No module named 'cairosvg'
- 8.6 Config For PyAgrum
-
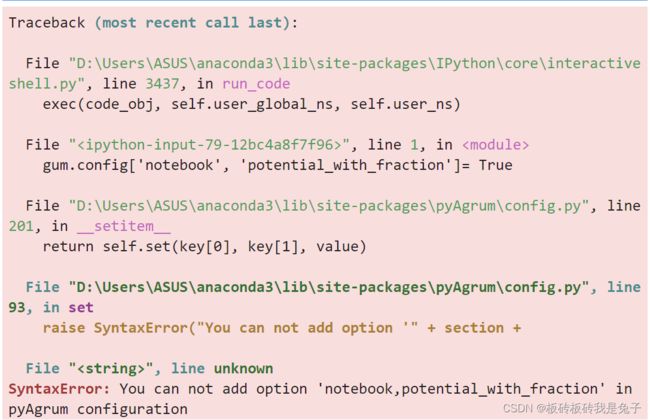
- 8.6.1 In[18]报错:You can not add option 'notebook,potential_with_fraction' in pyAgrum configuration
-
- 原因
- 解决方案
1 Tutorial
1.1 Water Sprinkler
1.1.1 “dot” not found in path.
解决方案:先下载graphviz,后下载pydot。
下载graphviz
graphviz下载路径 https://www.graphviz.org/download/.
下载后安装,安装过程中点击“同意进行环境配置”
重启
具体参考:Graphviz安装配置及入门.
下载pydot
pip install pydot
pip install pydot-ng
打开cmd输入dot -version观察是否输出正确。
1.1.2 不显示贝叶斯网络的结构图
编写工具改为Juypter,该工具可以将所有结果可视化,我之前用的spyder都失败了(只显示一行字)。
博主是用的anaconda配套的Juypter,也可以自行下载Juypterlab
#下载
pip install jupyterlab
#启动
jupyter-lab
如果代码中有%matplotlib inline,记得删除。
1.1.3 保存bif时显示“Stream states flags are not all unset.”
原因:保存路径未找到或路径中有中文出现。
1.1.4 Markov Blanket 和 Minimal conditioning set
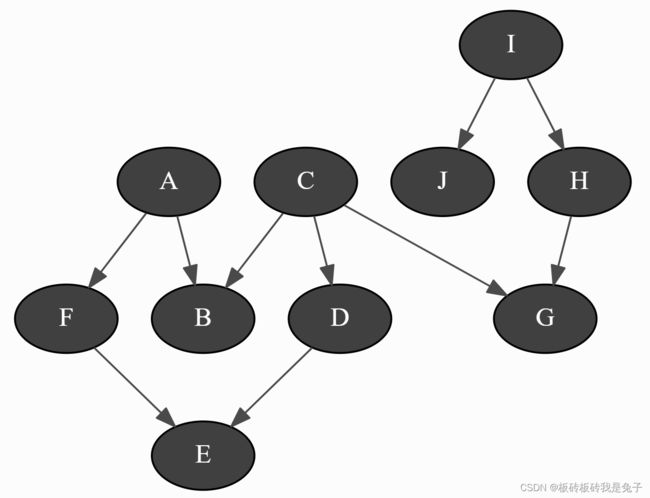
bn=gum.fastBN("A->B<-C->D->E<-F<-A;C->G<-H<-I->J")
bn
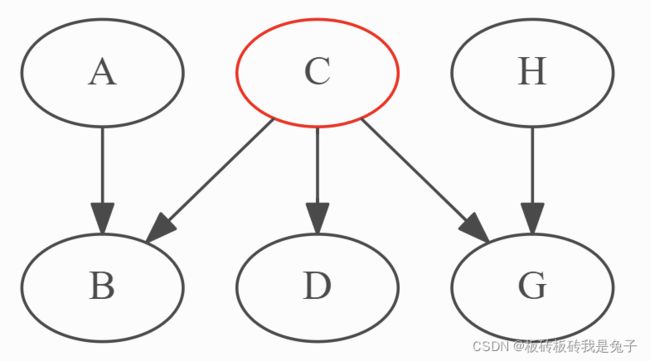
1.4.1 Markov Blanket
gum.MarkovBlanket(bn,"C")
1.4.2 Minimal Conditional Set
该名词的解释:For a variable and a list of variables, one can find the sublist that effectively impacts the variable if the list of variables was observed.
例子1
[bn.variable(i).name() for i in bn.minimalCondSet("B",["A","H","J"])]
#结果是['A']
这个需要考虑三种因子图。
具体请看链接:
解释:与B有关的只有A和C,而由于G没有被观测到,所以H和C无法形成关联。所以,最后只剩下A
例子2
[bn.variable(i).name() for i in bn.minimalCondSet("B",["A","G","H","J"])]
#结果是['A', 'G', 'H']
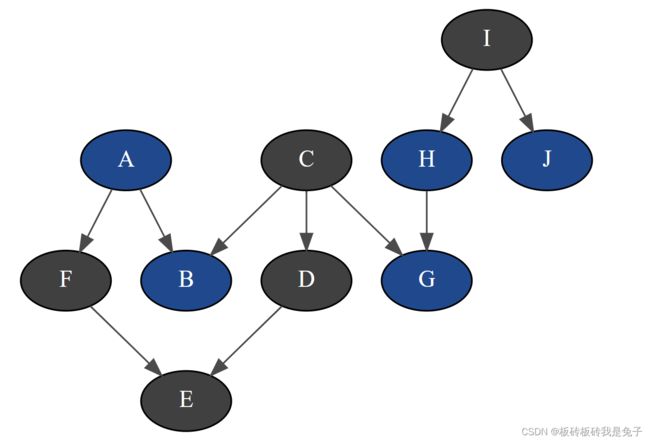
解释:与B有关的只有 A A A和 C C C, H H H和 G G G同时被观测到后,C和H条件独立( C ⊥ H ∣ G C\bot H\mid G C⊥H∣G)。由于没有观测到 I I I,所以J无法和H产生关联。最后与 B B B有关的就是 A , H , G A,H,G A,H,G。
1.2 alarm
1.2.1 gum.loadBN()后找不到该文件
下面是所有文件的资源,链接: aGrUM/pyAgrum。也可以单独下载文件
- 打开以上链接
- Find file
- 搜索所需文件,点击,下载至目标路径。
1.2.2 需修改的地方
修改保存路径,不然juypter找不到
gum.generateCSV(bn,"D:\\Bayesian network\\pyArum\\out\\tutorial2\\test.csv",1000,with_labels=True)
with open("D:\\Bayesian network\\pyArum\\out\\tutorial2\\test.csv","r") as src:
    for _ in range(10):
        print(src.readline(),end="")
from pyAgrum.lib.bn2roc import showROC_PR

showROC_PR(bn,"D:\\Bayesian network\\pyArum\\out\\tutorial2\\test.csv",
        target='CATECHOL',label='HIGH',  # class and label
        show_progress=True,show_fig=True,with_labels=True)
2 Example
2.1 Asthma(目前无问题)
2.2 Titanic
这个例子主要教了我们如何把数据集作为证据导入BN模型。
2.2.1 In[17]可优化
def update_beliefs(engine, bayesNet, row):
    # Update beliefs from a given row less the Survived variable
    for var in bayesNet.names():
        if var == "Survived":
            continue
        try:
            label = str(row.to_dict()[var])
            idx = bayesNet.variable(var).index(str(row.to_dict()[var]))#这一行可优化
            engine.chgEvidence(var, idx)
        except gum.NotFound:
            # this can happend when value is missing is the test base.
            pass
    engine.makeInference()
这一段代码定义了update_beliefs方法用来更新贝叶斯网络的信度。标注的哪一行应该改成
idx = bayesNet.variable(var).index(label)
上一行的label定义后面没有出现,应当是用在这里的。
2.2.2 In[17]的解释 and ROC_PR
bn.cpt('Survived')
def is_well_predicted(engine, bayesNet, auc, row):
    update_beliefs(engine, bayesNet, row)#更新证据
    marginal = engine.posterior('Survived')
    outcome = row.to_dict()['Survived']#最后outcome就是每个testdf行里的survived列的值
    if outcome == "False": # Did not survived
        if marginal.toarray()[1] < auc:
            return "True Positive"#
        else:
            return "False Negative"
    else: # Survived
        if marginal.toarray()[1] >= auc:
            return "True Negative"
        else:
            return "False Positive"

result = testdf.apply(lambda x: is_well_predicted(ie, bn, 0.5, x), axis=1)
#将testdf作为证据导入贝叶斯网络
最后一行apply()方法将相当于将训练集的每一行作为证据导入BN模型。
方法内部,第一步引用了上面的update_beliefs()用于更新证据。marginal得到更新数据后的后验概率。outcome是每个testdf行里的survived列的值。
m a r g i n a l . t o a r r a y ( ) [ 1 ] marginal.toarray()[1] marginal.toarray()[1]是True是值。
如果原数据是没有存活,而后验概率True的值小于0.5,说明预测结果是存活的概率小,那么预测结果就是对的,为 T r u e P o s i t i v e True Positive TruePositive。
如果原数据是没有存活,而后验概率True的值大于0.5,说明预测结果是存活的概率大,那么预测的结果是错的,为 F a l s e N e g a t i v e False Negative FalseNegative
如果原数据是存活,而后验概率True的值大于0.5,说明预测结果是结果是存活的概率大,那么预测结果是对的,为 T r u e N e g a t i v e True Negative TrueNegative
如果原数据是存活,而后验概率True的值小于0.5,说明预测结果是结果是存活的概率小,那么预测结果是错的的,为 F a l s e P o s i t i v e False Positive FalsePositive(假阳)
所以True,False代表预测结果是否正确,Positive和Negative我原本理解是,预测的结果是存活概率更大,就是positive,没存活就是negative,但是其实是完全相反的?不是很能理解。但是不影响计算预测结果的准确度。
后来经过查找,发现这部分内容涉及ROC曲线的知识,链接:机器学习基础(1)- ROC曲线理解
positives = sum(result.map(lambda x: 1 if x.startswith("True") else 0 ))
total = result.count()
print("{0:.2f}% good predictions".format(positives/total*100))
55.74% good predictions
showROC_PR(bn, 'D:\\Bayesian network\\pyArum\\resources\\titanic\\post_train.csv', 'Survived', 'True', True, True)
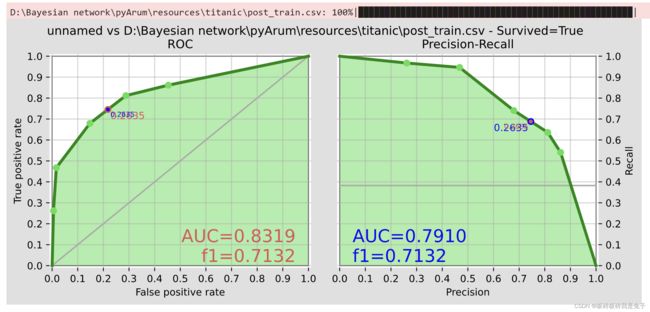 第一个图是ROC图,横坐标是假阳率,纵坐标是真阳率,一般来讲,假阳率和真阳率是负相关的,而模型的目的是想让假阳率越低,真阳率越高的。为了测试模型的性能,AUC的概念被提出,即ROC曲线以下坐标轴以上的面积。AUC越大则模型性能越好。
第二个图是Precise-Recall图,都是机器学习二分类模型评估中常见的性能度量指标。这两个指标是为了补充ROC指标只能表示Accuracy的局限性。因为有些问题,如恐怖分子识别问题,因为恐怖分子的数量在样本中非常的少,所以即使模型最后把所有人都识别为非恐怖分子,准确率都可能高达99.99%。
Precision从预测结果角度出发,描述了二分类器预测出来的正例结果中有多少是真实正例,即该二分类器预测的正例有多少是准确的;Recall从真实结果角度出发,描述了测试集中的真实正例有多少被二分类器挑选了出来,即真实的正例有多少被该二分类器召回。
2.3 Native Credit Default Modeling
2.3.1 In[20]报错:set_ ticks() got an unexpected keyword argument ’ labels’
错误代码:
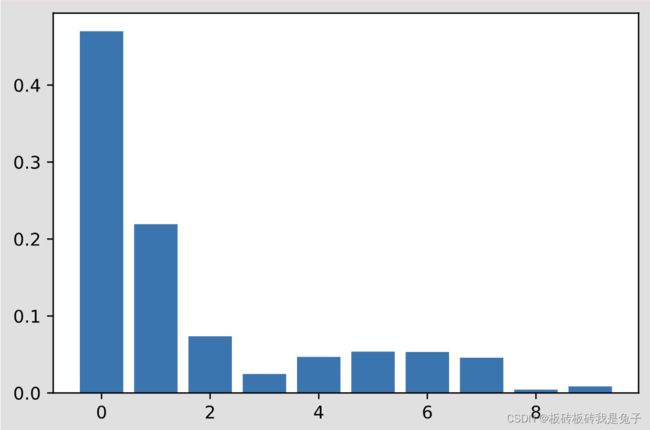
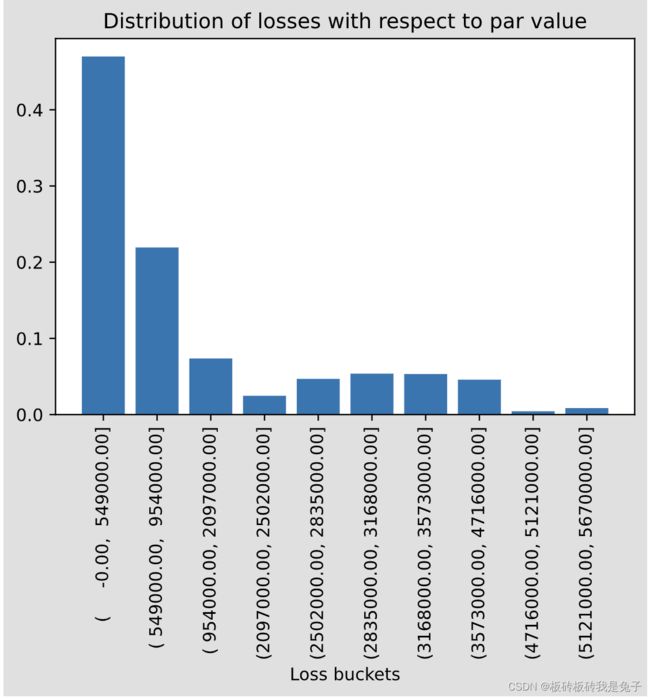
buckets =['(     -0.00,  549000.00]', '( 549000.00,  954000.00]', '( 954000.00, 2097000.00]', '(2097000.00, 2502000.00]', '(2502000.00, 2835000.00]', '(2835000.00, 3168000.00]', '(3168000.00, 3573000.00]', '(3573000.00, 4716000.00]', '(4716000.00, 5121000.00]', '(5121000.00, 5670000.00]']
ax.set_xticks(range(10),labels=new_labels, rotation=90)
设置图的坐标刻度label,新的代码应该是
ax.set_xticks(range(10))
ax.set_xticklabels(new_labels, rotation=90)
2.4 Causality and learning(别忘了改文件路径,其他无问题)
2.5 Sensitivity Analysis Using Credal Networks(暂无问题)
(需补充信度网络)
2.6 Quasi Continuous(暂无问题)
3 Models(目前无问题)
4 Learning
4.1 Structural Learning
4.1.1 gum has no attributes: generateSample
版本问题
pip install --user pyAgrum==0.22.9
4.1.2 In[10] unrecognized arguments: out/testTypeInduction.csv
修改路径,而且这一段的路径不能有空格!!!
5 6 7都没有问题
8 Tools
前4个没问题
8.5 Colouring And Exporting BNs
8.5.1 No module named ‘cairosvg’
pip install cairosvg
8.6 Config For PyAgrum
8.6.1 In[18]报错:You can not add option ‘notebook,potential_with_fraction’ in pyAgrum configuration
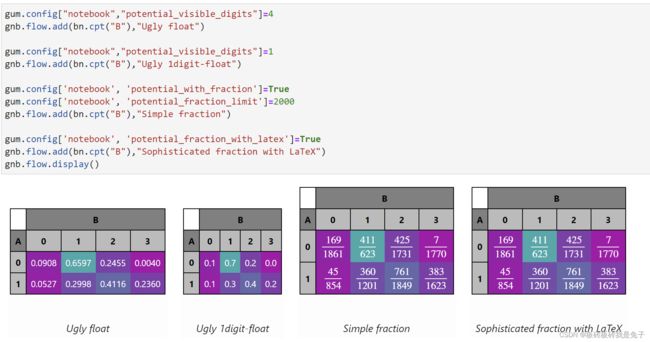
原代码:
import pyAgrum.lib.notebook as gnb

bn=gum.fastBN("D->C<-A->B[4];A->E")
gum.config["notebook","potential_visible_digits"]=1
gum.config['notebook', 'potential_color_0']="#AA00AA"
gum.config['notebook', 'potential_color_1']="#00FFAA"
gum.config["notebook","potential_visible_digits"]=4
gnb.flow.add(bn.cpt("B"),"Ugly float")

gum.config["notebook","potential_visible_digits"]=1
gnb.flow.add(bn.cpt("B"),"Ugly 1digit-float")
#后面的代码就报错了
gum.config['notebook', 'potential_with_fraction']=True
gum.config['notebook', 'potential_fraction_limit']=2000
gnb.flow.add(bn.cpt("B"),"Simple fraction")

gum.config['notebook', 'potential_fraction_with_latex']=True
gnb.flow.add(bn.cpt("B"),"Sophisticated fraction with LaTeX")
gnb.flow.display()
#bn.cpt("B")
原因
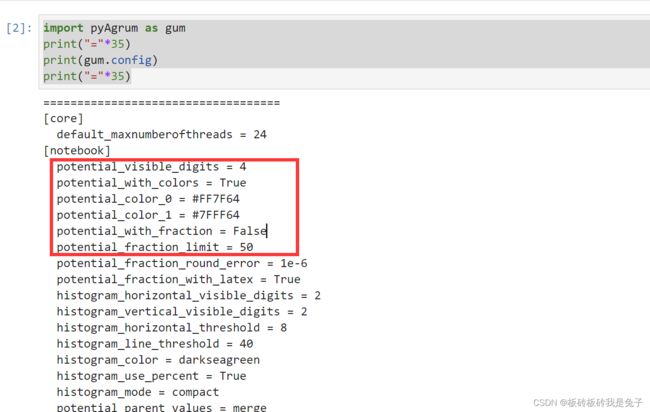
这个其实是因为bn中并没有potential_with_fraction和potential_fraction_with_latex。可以输出bn.cinfig看一下:
gum.config
[notebook]
  potential_visible_digits = 1
  potential_color_0 = #AA00AA
  potential_color_1 = #00FFAA
  default_arc_color = #AAAAAA
  default_node_bgcolor = yellow
  default_node_fgcolor = red
  evidence_bgcolor = green
并没有potential_with_fraction和potential_fraction_with_latex。
查找该例子的第一个输出,发现一开始gum.config就没有上面两个sector。
解决方案
应当是pyAgrum的版本不对。
pip install --user pyAgrum==0.22.9
查看新的版本是否有上面两个属性
import pyAgrum as gum
print("="*35)
print(gum.config)
print("="*35)
结束
