5 用Pandas库处理数据(透视表和交叉表)
1. 透视表
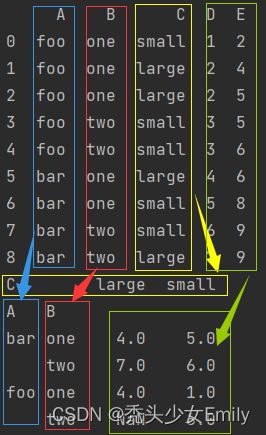
将DataFrame的列分别设置为行索引和列索引,然后对指定的列应用聚集函数,默认执行mean平均值。
格式:pivot_table(data: 'DataFrame', values=None, index=None, columns=None, aggfunc: 'AggFuncType' = 'mean', fill_value=None, margins: 'bool' = False, dropna: 'bool' = True, margins_name: 'str' = 'All', observed: 'bool' = False, sort: 'bool' = True)
参数说明:
- data:DataFrame对象;
- values:要聚合的列,相当于“值”;
- index:聚合值的分组,相当于“行”;
- columns:聚合值的分组,相当于是"列";
- aggfunc :应用的聚合函数,默认函数是均值,还可以是其他的比如;
- fill_value:有时候聚合结果里出现了NaN,想替换成0时,可以设fill_value=0;
- margins:默认为False,添加所有行或列的小计/总计时为True;
- dropna : 默认为True,跳过整行都是空缺值的行;
- margins_name:当margins设置为True时,设置总计的名称,默认是“ALL”;
- observed:这只适用于任何一个组属于分类的情况,如果为True:仅显示类别分组的观察值,如果为False:显示类别分组的所有值;
- sort:默认为True,指定是否应对结果进行排序。
这是官网给出的例子:
import pandas as pd
import numpy as np
df = pd.DataFrame({"A": ["foo", "foo", "foo", "foo", "foo",
                         "bar", "bar", "bar", "bar"],
                   "B": ["one", "one", "one", "two", "two",
                         "one", "one", "two", "two"],
                   "C": ["small", "large", "large", "small",
                         "small", "large", "small", "small",
                         "large"],
                   "D": [1, 2, 2, 3, 3, 4, 5, 6, 7],
                   "E": [2, 4, 5, 5, 6, 6, 8, 9, 9]})
print(df)
'''
     A    B      C  D  E
0  foo  one  small  1  2
1  foo  one  large  2  4
2  foo  one  large  2  5
3  foo  two  small  3  5
4  foo  two  small  3  6
5  bar  one  large  4  6
6  bar  one  small  5  8
7  bar  two  small  6  9
8  bar  two  large  7  9
'''
table = pd.pivot_table(df, values='D', index=['A', 'B'],
                       columns=['C'], aggfunc=np.sum)
print(table)
'''
C        large  small
A   B
bar one    4.0    5.0
    two    7.0    6.0
foo one    4.0    1.0
    two    NaN    6.0
'''
table_1 = pd.pivot_table(df, values='D', index=['A', 'B'],
                         columns=['C'], aggfunc=np.sum, fill_value=0)
print(table_1)
'''
C        large  small
A   B
bar one      4      5
    two      7      6
foo one      4      1
    two      0      6
'''
table_2 = pd.pivot_table(df, values=['D', 'E'], index=['A', 'C'],
                         aggfunc={'D': np.mean,
                                  'E': [min, max, np.mean]})
print(table_2)
'''
                  D   E
               mean max      mean min
A   C
bar large  5.500000   9  7.500000   6
    small  5.500000   9  8.500000   8
foo large  2.000000   5  4.500000   4
    small  2.333333   6  4.333333   2
'''
分析得到的table(太神奇了!),其他的结果是类似的。
2. 交叉表
用于统计分组频率的特殊透视表。
格式:crosstab(index, columns, values=None, rownames=None, colnames=None, aggfunc=None, margins: 'bool' = False, margins_name: 'str' = 'All', dropna: 'bool' = True, normalize=False)
参数说明:
- index:交叉表的行展示指定参数的内容。
- columns:交叉表的列展示指定参数的内容,
- values:根据index和columns需要聚类统计的指定参数内容,必须与aggfunc配合使用。
- rownames:默认无,如果传递,则必须与传入的index组数匹配。
- colnames:默认无,如果传递,则必须与传入的columns组数匹配。
- aggfunc:指定values的聚合方式。
- margins:默认为false,添加行或列小计。
- margins_name:默认为ALL,当margins为True时,包含所有行列。
- dropna:默认为True,不包含所有列为NaN的记录。
- normalize:默认为False,是否要进行规范化。
- 如果传入为‘all’或者是True,将所有的值进行归一化;如果传入为‘index’,根据每行进行归一化;如果传入为‘columns’,根据每列进行归一化;如果margins为True,小计列和行也会进行归一化。
官网的例子:
import pandas as pd
import numpy as np
a = np.array(["foo", "foo", "foo", "foo", "bar", "bar",
              "bar", "bar", "foo", "foo", "foo"], dtype=object)
b = np.array(["one", "one", "one", "two", "one", "one",
              "one", "two", "two", "two", "one"], dtype=object)
c = np.array(["dull", "dull", "shiny", "dull", "dull", "shiny",
              "shiny", "dull", "shiny", "shiny", "shiny"],
             dtype=object)
# a为index的值,[b, c]为columns的值,以a的值为行名,以b,c的值为列名
cross_table = pd.crosstab(a, [b, c], rownames=['a'], colnames=['b', 'c'])
print(cross_table)
'''
b    one        two
c   dull shiny dull shiny
a
bar    1     2    1     0
foo    2     2    1     2
'''
从python中pandas使用技巧之——【1】交叉表 crosstab - 知乎学习的列子:
import pandas as pd
import numpy as np
industry = ['农业', '农业', '林业', '林业', '养殖业', '养殖业']
region = ['农村', '城市', '城市', '农村', '城市', '农村']
id = [1, 2, 3, 4, 5, 6]
price = [234, 123, 34, 2343, 45, 54]

df = pd.DataFrame({'id': id, 'industry': industry, 'price': price, 'region': region})
print(df)
'''
   id industry  price region
0   1       农业    234     农村
1   2       农业    123     城市
2   3       林业     34     城市
3   4       林业   2343     农村
4   5      养殖业     45     城市
5   6      养殖业     54     农村
'''
# 统计频数
print(pd.crosstab(index=df['industry'], columns=df['region']))
'''
region    农村  城市
industry
养殖业        1   1
农业         1   1
林业         1   1
'''
# 统计占比
print(pd.crosstab(index=df['industry'], columns=df['region'],
                  normalize='index'))
'''
region     农村   城市
industry
养殖业       0.5  0.5
农业        0.5  0.5
林业        0.5  0.5
'''
# 按price进行聚合
print(pd.crosstab(index=df['industry'], columns=df['region'],
                  values=df['price'], aggfunc=np.sum))
'''
region      农村   城市
industry
养殖业         54   45
农业         234  123
林业        2343   34
'''
# 按price进行聚合并统计占比
print(pd.crosstab(index=df['industry'], columns=df['region'], values=df['price'],
                  aggfunc=np.sum, normalize='index'))
'''
region          农村        城市
industry
养殖业       0.545455  0.454545
农业        0.655462  0.344538
林业        0.985696  0.014304
'''
# 增加行列小计
print(pd.crosstab(index=df['industry'], columns=df['region'],
                  margins=True, margins_name='合计'))
'''
region    农村  城市  合计
industry
养殖业        1   1   2
农业         1   1   2
林业         1   1   2
合计         3   3   6
'''
