数据可视化(二)pandas和seaborn作图
pandas
pandas.DataFrame.plot(kind,x,y,title,figsize,grid)
可以通过Series或DataFrame对象调用,本质是对pyplot.plot()的一个包装器
kind默认为line折线图,gird默认为False不显示网格
例一
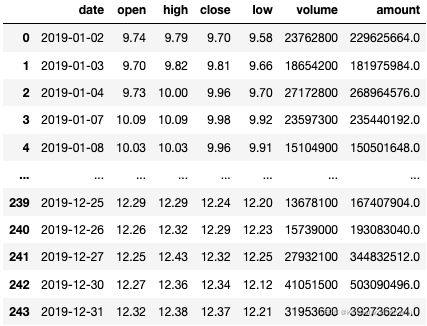
df = pd.read_csv(r'/.../600000.csv')
df['date'] = pd.to_datetime(df['date']) # 转换为时间序列
df.set_index('date',inplace=True) # 直接将'date'作为索引
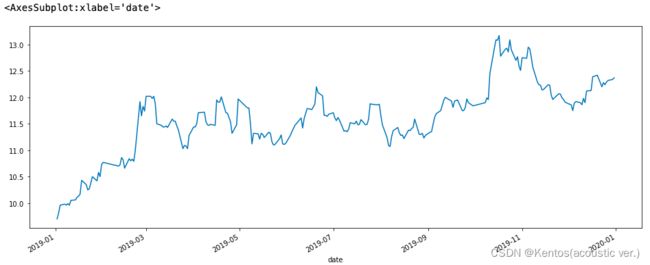
df['close'].plot(figsize = (16,6)) #绘制指定列和索引的折线图
plot有返回值,可将其赋给一个对象
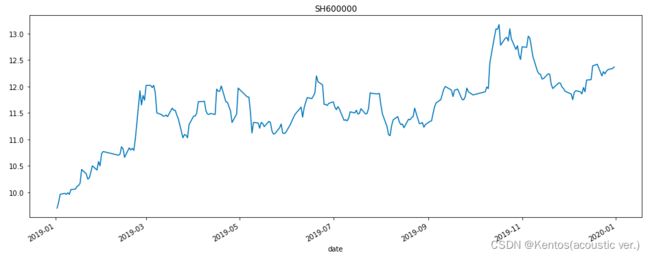
ax = df['close'].plot(figsize = (16,6)) # 将返回值赋给ax对象
ax.set_title('SH600000') # 通过对象调用pandas的方法
fig = ax.get_figure() # 将图片赋给figure对象
例二
# DataFrame直接调用plot
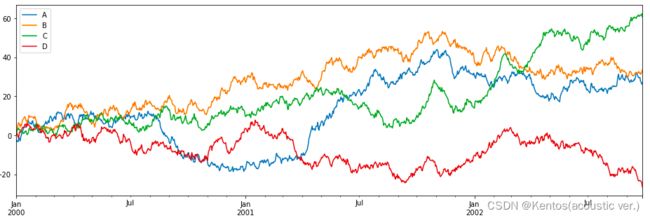
df = pd.DataFrame(np.random.randn(1000,4),
                  index=pd.date_range('1/1/2000',periods=1000), # 生成随机时间,开始时间为1/1/2000
                  columns=list('ABCD'))
df = df.cumsum() # 每一列累加,并覆盖原值
df.plot(figsize = (16,5)) #默认indx作为x
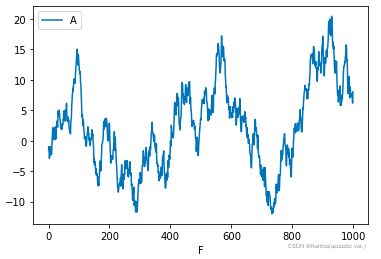
例三
# DataFrame调用plot
df = pd.DataFrame(np.random.randn(1000,4),
                  columns=list('ABCD'))
df['A'] = df['A'].cumsum() # 累加
df['F'] = pd.Series(list(range(len(df)))) # 索引
df.plot(x='F',y='A') # xy只用指定列名即可
条形图
DataFrame.plot(kind='bar')或DataFrame.plot.bar()
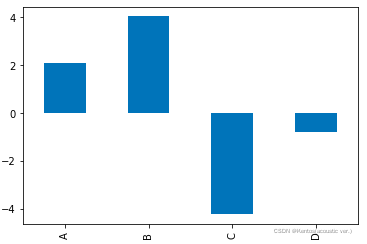
Series
# Series
df = pd.DataFrame(np.random.randn(1000,4),
                  columns=list('ABCD'))
df = df.cumsum()
df.iloc[5].plot(kind='bar') # 取出第五行的数据Series,列名作为x轴
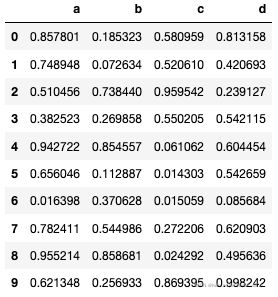
DataFrame
# DataFrame
df = pd.DataFrame(np.random.rand(10,4),columns=['a','b','c','d'])
df.plot.bar(figsize=(12,5))
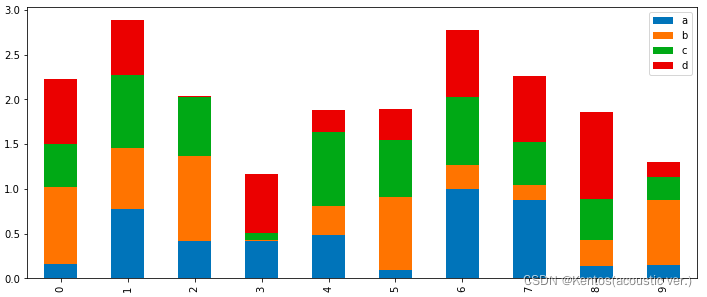
堆积条形图
# 堆积条形图
df = pd.DataFrame(np.random.rand(10,4),columns=['a','b','c','d'])
df.plot.bar(figsize=(12,5),stacked=True)
柱形图
# 柱形图
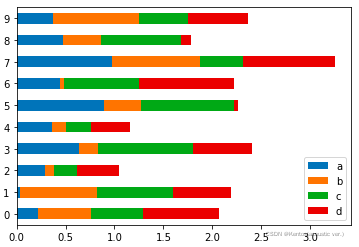
df = pd.DataFrame(np.random.rand(10,4),columns=['a','b','c','d'])
df.plot.barh(stacked=True)
直方图
展示单个变量的分布情况
DataFrame.plot(kind='hist')或DataFrame.plot.hist()
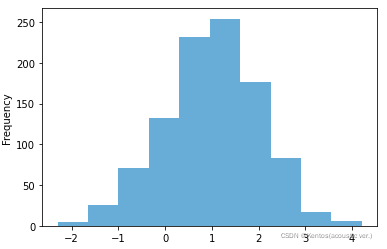
Series
df = pd.DataFrame({'a':np.random.randn(1000) + 1,
                  'b':np.random.randn(1000),
                  'c':np.random.randn(1000) - 1},
                  columns=['a','b','c'])
df['a'].plot.hist(alpha=0.6)
DataFrame
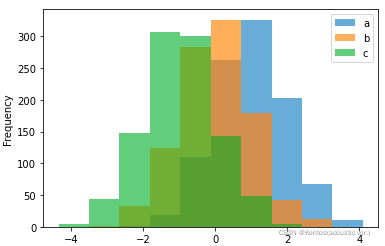
# DataFrame
df = pd.DataFrame({'a':np.random.randn(1000) + 1,
                  'b':np.random.randn(1000),
                  'c':np.random.randn(1000) - 1},
                  columns=['a','b','c'])
df.plot.hist(alpha=0.6) # 默认在同一个图中展示多个变量,但一般不会这样用
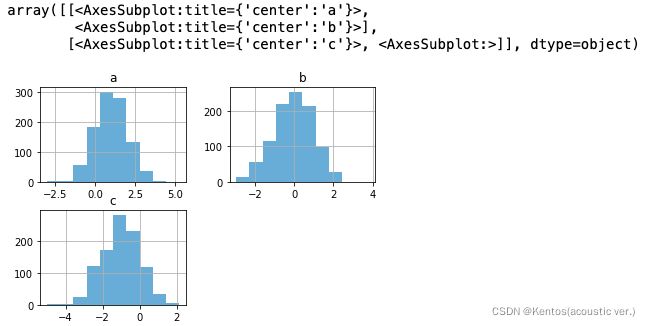
df = pd.DataFrame({'a':np.random.randn(1000) + 1,
'b':np.random.randn(1000),
'c':np.random.randn(1000) - 1},
columns=['a','b','c'])
df.hist(alpha=0.6) # 通过DataFrame直接调用hist()饼图
DataFrame.plot(kind='pie')或DataFrame.plot.pie()
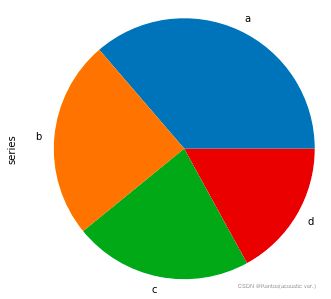
Series
# Series
series = pd.Series(3*np.random.rand(4), # 注意饼图所有变量取值应该为正
                  index=['a','b','c','d'],
                  name='series')
series.plot.pie(figsize=(6,6))
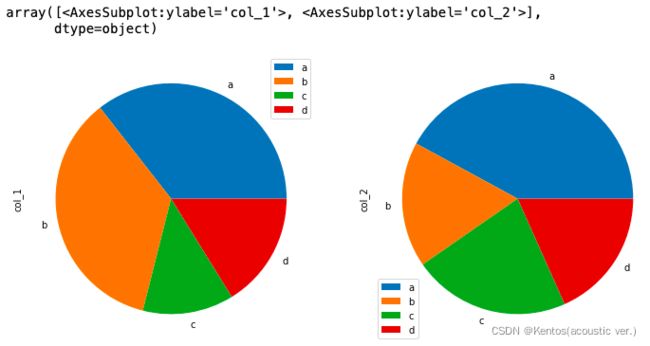
DataFrame
# DataFrame
df = pd.DataFrame(3*np.random.rand(4,2),
                  index=['a','b','c','d'],
                  columns=['col_1','col_2'])
df.plot.pie(subplots=True,figsize=(12,8)) # 以子图的方式呈现多个字段的特征
散点图
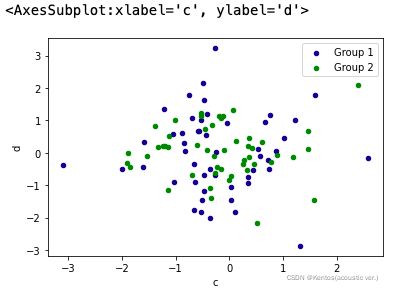
两个变量
df = pd.DataFrame(np.random.randn(50,4),
                  columns=['a','b','c','d'])
ax = df.plot.scatter(x='a',y='b',color='DarkBlue',label='Group 1')
df.plot.scatter(x='c',y='d',color='g',label='Group 2',ax=ax) # 直接将坐标系赋给想要画的对象
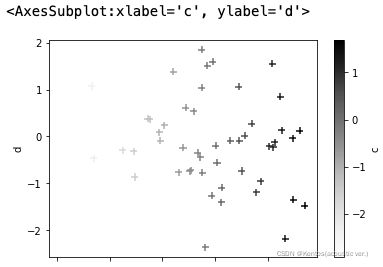
三个变量
# 三维:颜色深浅
df = pd.DataFrame(np.random.randn(50,4),
                  columns=['a','b','c','d'])
df.plot.scatter(x='c',y='d',c='c',s=50,marker='+') # 将c列作为颜色 s=50是第四维:大小
Seaborn
seaborn样式
darkgrid, dark, whitegrid, white, ticks
通过set_style()函数选择样式
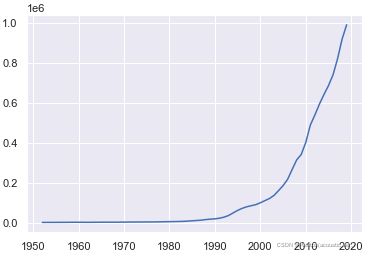
df_gdp = pd.read_csv(r'/.../gdp_data.csv')

sns.set_style('darkgrid') # 全局的影响

plt.plot(df_gdp['year'],df_gdp['gdp'])
通过set()方法
可以同时设置主题、调色板等多个参数
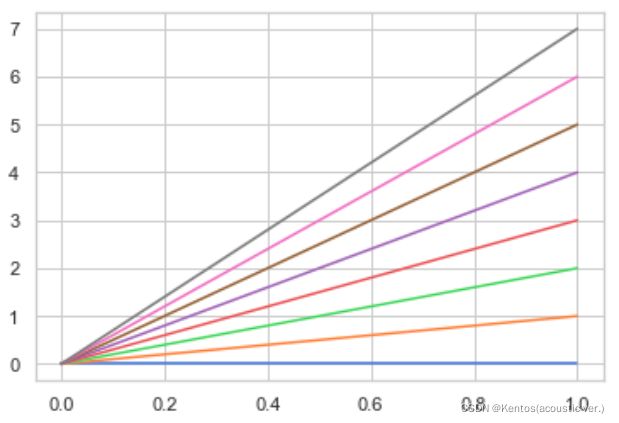
sns.set(style='whitegrid',palette='muted') # 先设置后作图
plt.plot(np.c_[np.zeros(8),np.arange(8)].T)
单变量分布图
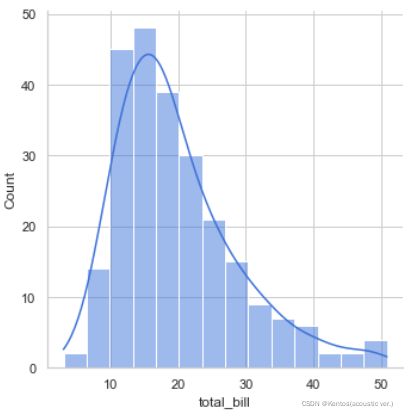
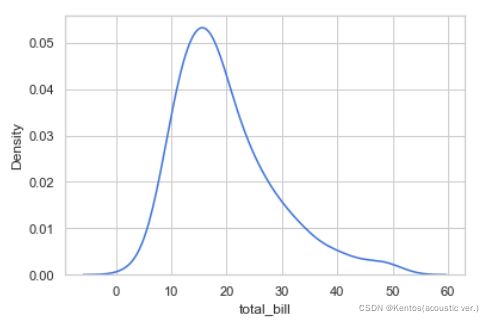
displot()
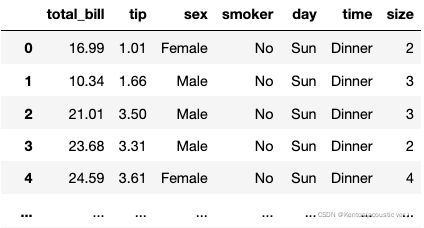
tips = pd.read_csv(r'/.../tips.csv')
sns.displot(tips['total_bill'],kde=True) # kde密度曲线
tips
kdeplot()
sns.kdeplot(tips['total_bill']) # 只绘制密度曲线多变量分布图
一般使用散点图来描述两个变量的相关关系
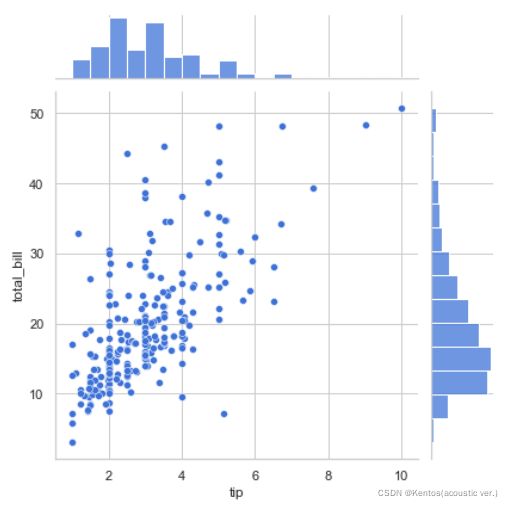
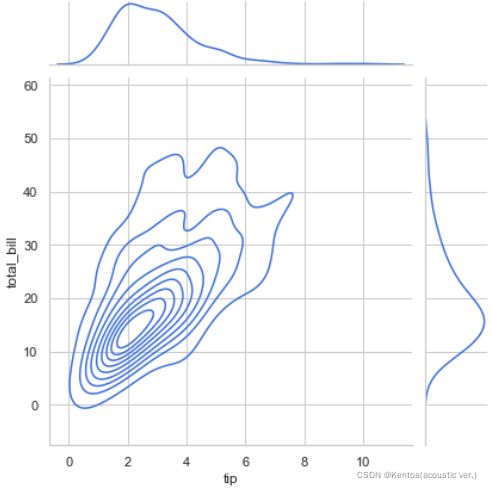
jointplot()
不仅显示两个变量的相关情况,也显示单个变量的分布情况
传入的数据类型为DataFrame
sns.jointplot(x='tip',y='total_bill',data=tips) # data需要是DataFrame类型的,xy分别为DataFrame的列名,data是数据来源sns.jointplot(x='tip',y='total_bill',data=tips,kind='kde') # 改为密度图pairplot()
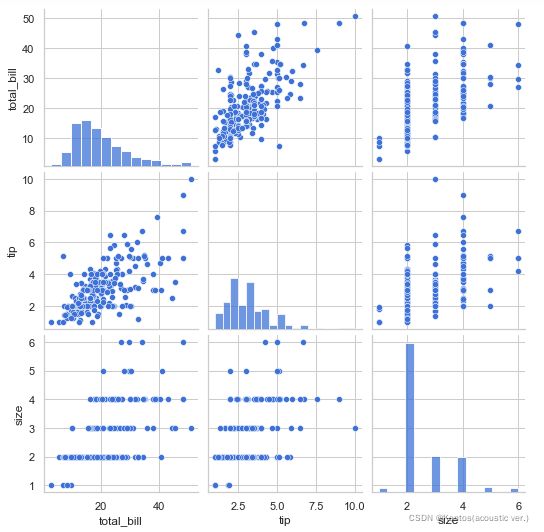
绘制整个数据集两两对应的多变量分布图
自己对应自己时绘制单变量分布图(直方图)
不适用于数据量过大的情况
sns.pairplot(data=tips)分类散点图
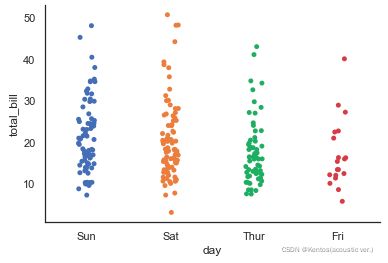
stripplot()
sns.set(style='white')
sns.stripplot(x='day',y='total_bill',data = tips) # 度量变量在每个分类上的取值
sns.despine() # 去除坐标轴
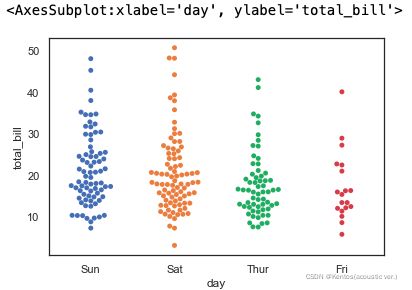
swarmplot()
sns.swarmplot(x='day',y='total_bill',data = tips) # 打散,可以看清楚每一个数据点回归图
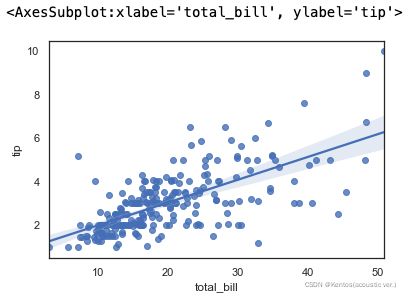
regplot()
回归线
阴影部分是95%的置信区间 ci=None去掉阴影部分
sns.regplot(x='total_bill',y='tip',data = tips)lmplot()
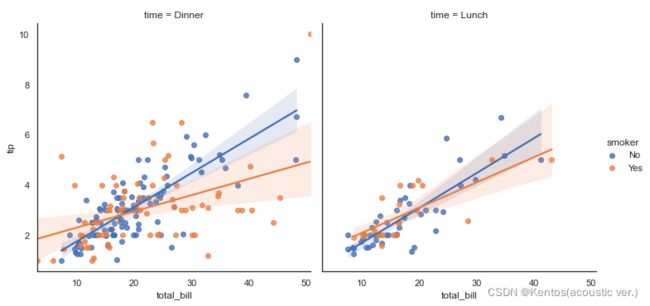
三维用颜色表示
再加一个分类变量,绘制不同的子图
sns.lmplot(x='total_bill',y='tip',data = tips,hue='smoker',col='time') # smoker是分类变量箱线图
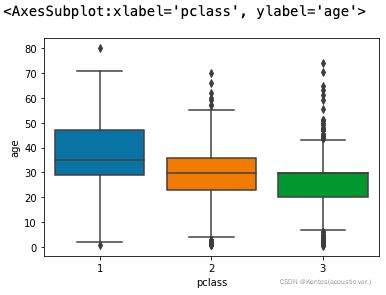
ttn = pd.read_csv(r'/.../titanic.csv')  # 读取文件
sns.boxplot(ttn['pclass'],ttn['age'])
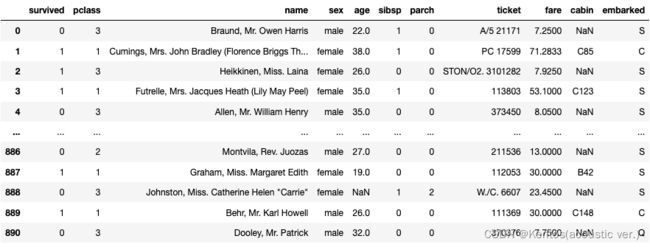
titanic.csv
