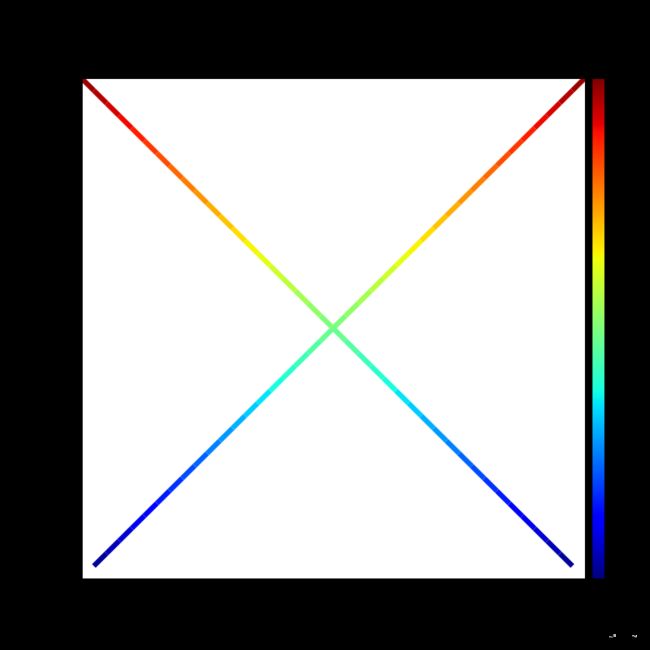
用Python画colorbar渐变图+修改刻度大小+修改渐变颜色
Draw Gradient Color Map using python
github源码地址:
欢迎关注我!
pratical_skills_tools
Draw Gradient Color Map
Dependencies
- pandas
- matplotlib
- numpy
- seaborn
You can configure it using pip install XXX in terminal.
Results
Using and Explanation
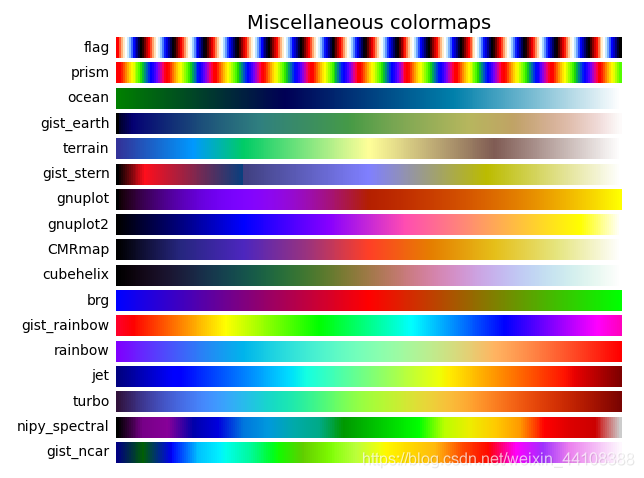
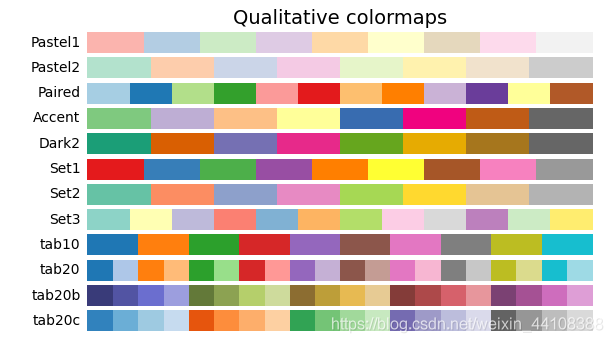
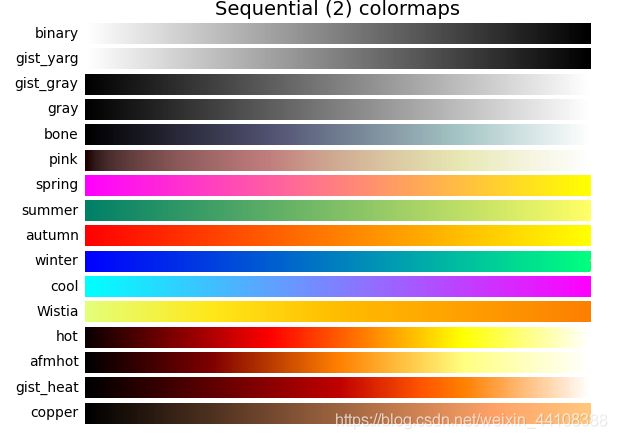
1.改变颜色的种类
在程序path_Results.py文件中,修改plot_results_path函数中的:
lc = gd.colorline(x, y, z, cmap=plt.get_cmap('cool'), linewidth=linewidth_car) # 'jet' #'cool'
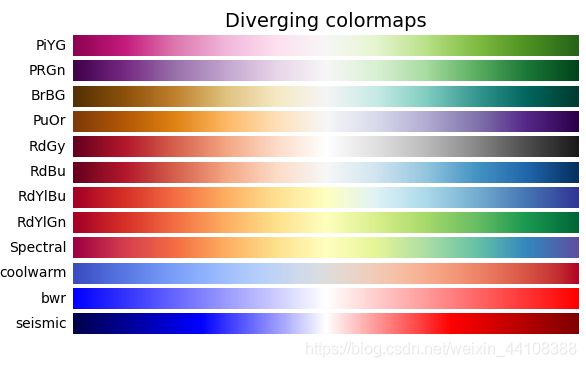
中的cmap=plt.get_cmap('cool')参数即可。可以设置的有:
参考 matplotlib tutorials中的colors部分
举例:



2.改变图例的标注范围
可以进行图例colorbar刻度的调整,包括平移和比例放缩:
在程序path_Results.py文件中,plot_gd_bar函数中的:
def plot_gd_bar(fig, ax, lc, max_pro, max_tran=0, cars_num=1, car_num=0, offset=0):
参数:
max_pro: 调整比例
max_tran: 调整偏移量
比如main.py中函数调用的时候:
cb = paths.plot_gd_bar(fig, ax, lc, result0[-1, 2], 10)
 #最后两个参数一个是调整比例,一个是调整偏移量
比例放缩的含义:原本[0,5]可以调整为[0,10],在上面函数调用中的result0[-1, 2]处写上2即可;
平移的含义:原本[0,5]可以调整为[2,7],在上面函数调用中的10处写上2即可。
具体效果可以看figure2和figure3的对比,偏移了10个单位。
Steps:
1.load CSV files
result0 = pd.read_csv("mp_1.csv")
result1 = pd.read_csv("mp_2.csv")
result0 = result0.values
result1 = result1.values
the file:
first row: x data
second row: y data
third row: z data, which is to set the gradient color map.
2.set the size of map and the limits of x axis and y axis
#设置画布
width_img = 5
height_img = 5
fig = plt.figure(figsize=(int(width_img)+2, int(height_img)+2),
             facecolor='none')
ax = plt.gca()
#设置图像上下界
plt.xlim(0,20)
plt.ylim(0,20)
3.draw color map
lc = paths.plot_results_path(result0,4)
lc2 = paths.plot_results_path(result1, 4)
4.draw colorbar
可以进行图例colorbar刻度的调整,包括平移和比例放缩:
比例放缩的含义:原本[0,5]可以调整为[0,10],在下面函数调用中的result0[-1, 2]处写上2即可;
平移的含义:原本[0,5]可以调整为[2,7],在下面函数调用中的10处写上2即可;
cb = paths.plot_gd_bar(fig, ax, lc, result0[-1, 2], 10)
 #最后两个参数一个是调整比例,一个是调整偏移量
Notice:
plot_gd_bar(fig, ax, lc, result0[-1, 2], 10)
#最后两个参数一个是调整比例,一个是调整偏移量
Notice:
以上方便修改和调整的是main.py和path_Result.py,gradient.py最好不要修改。
imshow函数在画plot_gd_bar之前。
