胎儿产科生长发育曲线 ,体重估计,公式和绘图、参考文献、python代码
1. 参考资料
-
Leung TN, Pang MW, Daljit SS, Leung TY, Poon CF, Wong SM, Lau TK. Fetal biometry in ethnic Chinese: biparietal diameter, head circumference, abdominal circumference and femur length. Ultrasound Obstet Gynecol. 2008 Mar;31(3):321-7. doi: 10.1002/uog.5192. PMID: 18241086. 【论文链接】
-
Hadlock FP, Harrist RB, Sharman RS, Deter RL, Park SK. Estimation of fetal weight with the use of head, body, and femur measurements–a prospective study. Am J Obstet Gynecol. 1985 Feb 1;151(3):333-7. doi: 10.1016/0002-9378(85)90298-4. PMID: 3881966. 【论文链接】
-
Cheng YKY, Lu J, Leung TY, Chan YM, Sahota DS. Prospective assessment of INTERGROWTH-21st and World Health Organization estimated fetal weight reference curves. Ultrasound Obstet Gynecol. 2018 Jun;51(6):792-798. doi: 10.1002/uog.17514. PMID: 28452092. 【论文链接】
-
香港中文大学-妇产科学系 孕生通
2. 根据孕周估计测量值

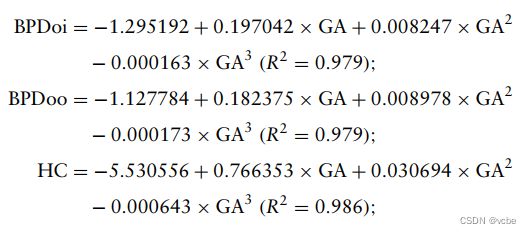
以上BPDoi 和BPDoo分别代表两种测量规则下的BPD测量值:
BPDoi:biparietal diameter outer-inner
BPDoo: biparietal diameter outer-outer
2.1 公式转换代码
def get_meanSD(tp,ga):
    if tp=="BPD":
        mean=-1.295192+0.197042*ga+0.008247*np.power(ga,2)-0.000163*np.power(ga,3)
        sd=1.253*(0.176839+0.002757*ga)
    if tp=="HC":
        mean=-5.530556+0.766353*ga+0.030649*np.power(ga,2)-0.000643*np.power(ga,3)
        sd=1.253*(0.539913+0.007092*ga)
    if tp=="AC":
        mean=-6.181539+0.884154*ga+0.013282*np.power(ga,2)-0.000255*np.power(ga,3)
        sd=1.253*(0.056796+0.031209*ga)
    if tp=="FL":
        mean=-4.445082+0.492073*ga-0.0067*np.power(ga,2)+0.000042*np.power(ga,3)
        sd=1.253*(0.103184+0.002539*ga)
    return mean,sd
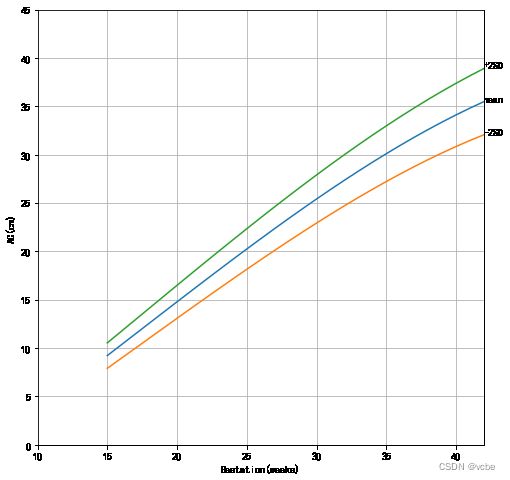
2.2 绘制根据孕周估计AC的曲线
fig=plt.figure(figsize=(8,8))
x=np.arange(15,43)

AC=[get_meanSD("AC",i)[0] for i in x]
AC_SD=[get_meanSD("AC",i)[1] for i in x]
AC_sub_SD=[ac-2*sd for ac,sd in zip(AC,AC_SD)]
AC_add_SD=[ac+2*sd for ac,sd in zip(AC,AC_SD)]

plt.ylim(0,45)
plt.xlim(10,42)
ax=fig.gca()
ax.set_xticks(np.arange(10, 42, 5))
ax.set_yticks(np.arange(0, 50, 5))
plt.text(s="+2SD",x=42,y=AC_add_SD[-1])
plt.text(s="mean",x=42,y=AC[-1])
plt.text(s="-2SD",x=42,y=AC_sub_SD[-1])
plt.grid()
plt.plot(x,AC)
plt.plot(x,AC_sub_SD)
plt.plot(x,AC_add_SD)
plt.xlabel("Gestation(weeks)")
plt.ylabel("AC(cm)")
plt.show()
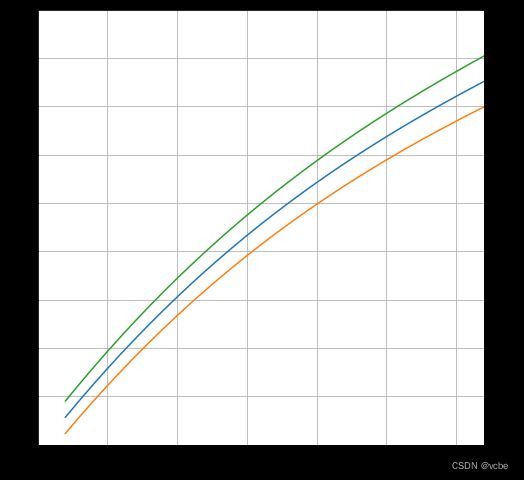
2.3 绘制根据孕周估计HC的曲线
fig=plt.figure(figsize=(8,8))
x=np.arange(15,43)

HC=[get_meanSD("HC",i)[0] for i in x]
HC_SD=[get_meanSD("HC",i)[1] for i in x]
HC_sub_SD=[hc-2*sd for hc,sd in zip(HC,HC_SD)]
HC_add_SD=[hc+2*sd for hc,sd in zip(HC,HC_SD)]


plt.ylim(0,45)
plt.xlim(10,42)
ax=fig.gca()
ax.set_xticks(np.arange(10, 42, 5))
ax.set_yticks(np.arange(0,50, 5))
plt.grid()
plt.plot(x,HC)
plt.plot(x,HC_sub_SD)
plt.plot(x,HC_add_SD)

plt.text(s="+2SD",x=43,y=HC_add_SD[-1])
plt.text(s="mean",x=43,y=HC[-1])
plt.text(s="-2SD",x=43,y=HC_sub_SD[-1])

plt.xlabel("Gestation(weeks)")
plt.ylabel("HC(cm)")
plt.show()
2.4 绘制根据孕周估计BPD(oi)的曲线
fig=plt.figure(figsize=(8,8))
x=np.arange(12,43)

BPD=[10*get_meanSD("BPD",i)[0] for i in x]
BPD_SD=[10*get_meanSD("BPD",i)[1] for i in x]
BPD_sub_SD=[bpd-2*sd for bpd,sd in zip(BPD,BPD_SD)]
BPD_add_SD=[bpd+2*sd for bpd,sd in zip(BPD,BPD_SD)]


plt.ylim(0,110)
plt.xlim(10,42)
ax=fig.gca()
ax.set_xticks(np.arange(10, 42, 5))
ax.set_yticks(np.arange(0,120, 10))
plt.grid()
plt.plot(x,BPD)
plt.plot(x,BPD_sub_SD)
plt.plot(x,BPD_add_SD)

plt.text(s="+2SD",x=43,y=BPD_add_SD[-1])
plt.text(s="mean",x=43,y=BPD[-1])
plt.text(s="-2SD",x=43,y=BPD_sub_SD[-1])

plt.xlabel("Gestation(weeks)")
plt.ylabel("BPD(mm)")
plt.show()
2.5 绘制根据孕周估计FL的曲线
#FL
fig=plt.figure(figsize=(8,8))
x=np.arange(12,43)

FL=[10*get_meanSD("FL",i)[0] for i in x]
FL_SD=[10*get_meanSD("FL",i)[1] for i in x]
FL_sub_SD=[fl-2*sd for fl,sd in zip(FL,FL_SD)]
FL_add_SD=[fl+2*sd for fl,sd in zip(FL,FL_SD)]


plt.ylim(0,90)
plt.xlim(10,42)
ax=fig.gca()
ax.set_xticks(np.arange(10, 42, 5))
ax.set_yticks(np.arange(0,100, 10))
plt.grid()
plt.plot(x,FL)
plt.plot(x,FL_sub_SD)
plt.plot(x,FL_add_SD)

plt.text(s="+2SD",x=43,y=FL_add_SD[-1])
plt.text(s="mean",x=43,y=FL[-1])
plt.text(s="-2SD",x=43,y=FL_sub_SD[-1])

plt.xlabel("Gestation(weeks)")
plt.ylabel("FL(mm)")
plt.show()
3. 根据测量值估算孕周
4. 根据测量值估计胎儿体重
4.1 HeadLock 公式
4.2 H e a d L o c k 3 HeadLock^3 HeadLock3 体重估计公式
def get_weight(ac,fl,hc):
    return np.power(10,1.326-0.00326*ac*fl+0.0107*hc+0.0438*ac+0.158*fl)
4.3 H e a d L o c k 3 HeadLock^3 HeadLock3 根据孕周估算体重公式
def get_weight_by_ga(ga):
    ac,_=get_meanSD("AC",ga)
    fl,_=get_meanSD("FL",ga)
    hc,_=get_meanSD("HC",ga)
    return get_weight(ac,fl,hc)
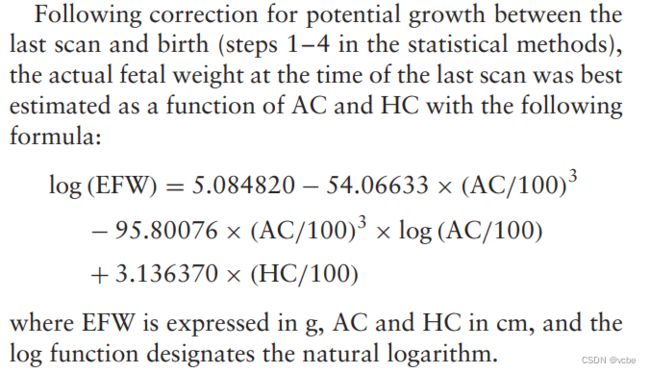
4.4 I N T E R G R O U W T H − 2 1 s t INTERGROUWTH-21^{st} INTERGROUWTH−21st公式
def get_weight(ac,fl,hc):
   return np.exp(5.084820-54.06633*np.power(ac/100.,3)-95.80076*np.power(ac/100,3)*np.ln(ac/100))+3.136370*(HC/100)
4.5 Z-score 计算公式
4.6 百分位计算公式
4.7 体重估计曲线公式
def get_weight_mean(ga):
    miu=0.556843+0.333584*ga-0.003642*np.power(ga,2)
    delt=np.exp(-3.644433-0.022691*ga)
    v=-18.787389+0.695183*ga
    u= np.exp(np.power(-2*v*delt+1,1/ga)*miu)
    f=np.exp(np.power(2*v*delt+1,1/ga)*miu)

    return (f-u)/2+u

def get_weight_90th(ga):
    miu=0.556843+0.333584*ga-0.003642*np.power(ga,2)
    delt=np.exp(-3.644433-0.022691*ga)
    v=-18.787389+0.695183*ga
    return np.exp(np.power(1.28*v*delt+1,1/v)*miu)


def get_weight_10th(ga):
    miu=0.556843+0.333584*ga-0.003642*np.power(ga,2)
    delt=np.exp(-3.644433-0.022691*ga)
    v=-18.787389+0.695183*ga
    return np.exp(np.power(-1.28*v*delt+1,1/v)*miu)
    ```

## 4.8 体重估计曲线绘制
```python
fig=plt.figure(figsize=(8,8))
x=np.arange(12,43)

weight=[get_weight_mean(i) for i in x]
weight10=[get_weight_10th(i) for i in x]
weight90=[get_weight_90th(i) for i in x]

plt.ylim(0,4500)
plt.xlim(10,42)
ax=fig.gca()
ax.set_xticks(np.arange(10, 43, 5))
ax.set_yticks(np.arange(0, 4700, 500))
plt.grid()
plt.plot(x,weight)
plt.plot(x,weight10)
plt.plot(x,weight90)
plt.text(s="90th百分位",x=43,y=weight90[-1])
plt.text(s="mean",x=43,y=weight[-1])
plt.text(s="10th百分位",x=43,y=weight10[-1])
plt.xlabel("Gestation(weeks)")
plt.ylabel("Weight(g)")
plt.show()


