图森TuSimple车道线检测数据集介绍
原文:
https://github.com/TuSimple/tusimple-benchmark/tree/master/doc/lane_detection
数据集下载地址:
道路上的对象可以分为两大类:静态对象和动态对象。 车道标记是高速公路上的主要静态组成部分。 他们指示车辆以交互方式安全地在高速公路上行驶。 为了鼓励人们解决高速公路上的车道检测问题,我们发布了大约7,000个1秒钟长的20帧长的视频剪辑。
车道检测是自动驾驶中的一项关键任务,它为汽车的控制提供定位信息。 我们为此任务提供了视频剪辑,每个剪辑的最后一帧都包含带标签的车道。 该视频剪辑可以帮助算法推断出更好的车道检测结果。 通过剪辑,我们希望竞争对手能提出更有效的算法。 对于自动驾驶车辆,时间/内存效率算法意味着更多资源可用于其他算法和工程流水线。
同时,我们希望参与者考虑自动驾驶车道的语义,而不是检测道路上的每个车道标记。 因此,注释和测试集中在当前车道和左/右车道上。
我们将有一个排行榜,显示提交的评估结果。 我们为前三名参赛者提供奖品,CVPR 2017自动驾驶挑战赛讲习班也将提及这些奖品。
数据集特征
复杂性:
- 良好和中等天气条件
- 白天不同
- 2车道/ 3车道/ 4车道/或更多高速公路
- 不同的交通状况
规模:
- 训练:3626个视频剪辑,3626个带标注的帧(每个剪辑clips有20帧,最后一帧带有标注)
- 测试:2782个视频剪辑
相机和视频片段:
- 1s剪辑20帧
- 相机的视线方向非常接近行车方向
注释类型:
- 车道标记折线
数据集细节
目录结构
训练/测试数据集的目录结构如下。 我们有一个JSON文件来指导您如何使用clips目录中的数据。
dataset
|
|----clips/ # 视频剪辑
|------|
|------|----some_clip/ # 剪辑中的序列图像, 共20帧
|------|----…
|
|----tasks.json # 训练集中的标记数据,以及测试集中的提交模板。
示例
演示代码显示了车道数据集的数据格式和评估工具的用法。
import json
import numpy as np
import cv2
import matplotlib.pyplot as plt
from evaluate.lane import LaneEval
%matplotlib inline
假设我们有两个json文件,一个是ground truth,另一个是预测。
我们假设预测json文件中的每一行都对应于地面真实json,这意味着这两行都与同一张图片相关。
json_pred = [json.loads(line) for line in open('pred.json').readlines()]  # 二者好像没什么区别
json_gt = [json.loads(line) for line in open('label_data.json')]
pred, gt = json_pred[0], json_gt[0]
pred_lanes = pred['lanes']
run_time = pred['run_time']
gt_lanes = gt['lanes']
y_samples = gt['h_samples']
raw_file = gt['raw_file']
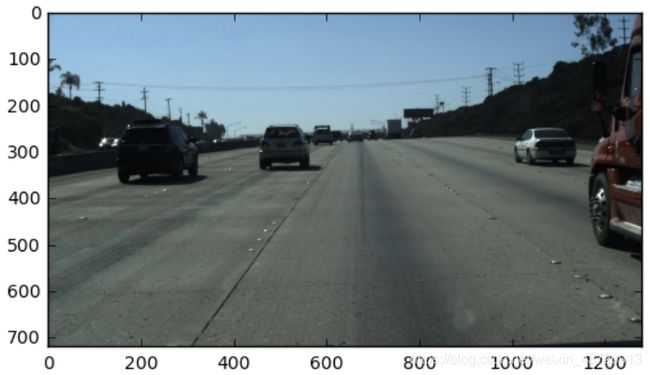
首先看一下图像。
img = plt.imread(raw_file)
plt.imshow(img)
plt.show()
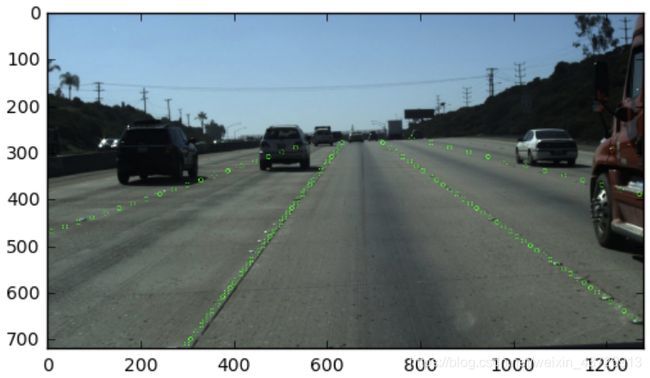
其次看一下怎么用y_samples。
img_vis = img.copy()

for lane in gt_lanes_vis:
    for pt in lane:
        cv2.circle(img_vis, pt, radius=5, color=(0, 255, 0))

plt.imshow(img_vis)
plt.show()
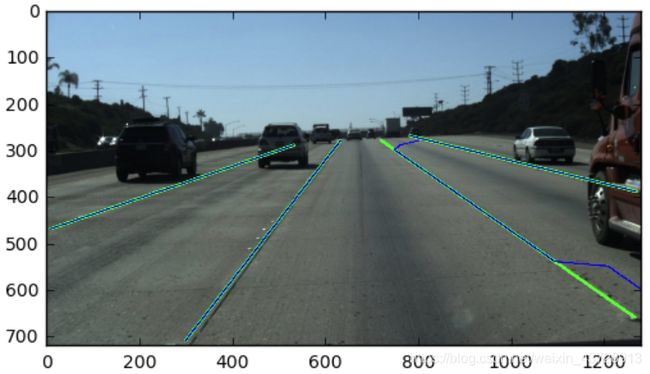
 再次我们看一下真值和预测值的样例。
gt_lanes_vis = [[(x, y) for (x, y) in zip(lane, y_samples) if x >= 0] for lane in gt_lanes]
pred_lanes_vis = [[(x, y) for (x, y) in zip(lane, y_samples) if x >= 0] for lane in pred_lanes]
img_vis = img.copy()

for lane in gt_lanes_vis:
    cv2.polylines(img_vis, np.int32([lane]), isClosed=False, color=(0,255,0), thickness=5)
for lane in pred_lanes_vis:
    cv2.polylines(img_vis, np.int32([lane]), isClosed=False, color=(0,0,255), thickness=2)

plt.imshow(img_vis)
plt.show()
 现在,我们可以使用该工具根据数据评估预测。
benchmark网页上描述了评估指标。
np.random.shuffle(pred_lanes)
# 整个数据集上的准确率Acc、FP、FN
print LaneEval.bench(pred_lanes, gt_lanes, y_samples, run_time)

benchmark网页如下。
import numpy as np
from sklearn.linear_model import LinearRegression
import ujson as json


class LaneEval(object):
    lr = LinearRegression()
    pixel_thresh = 20
    pt_thresh = 0.85

    @staticmethod
    def get_angle(xs, y_samples): # 得到车道线与水平方向夹角
        xs, ys = xs[xs >= 0], y_samples[xs >= 0]
        if len(xs) > 1:
            LaneEval.lr.fit(ys[:, None], xs)
            k = LaneEval.lr.coef_[0]
            theta = np.arctan(k)
        else:
            theta = 0
        return theta

    @staticmethod
    def line_accuracy(pred, gt, thresh): # 车道线的准确率
        pred = np.array([p if p >= 0 else -100 for p in pred])
        gt = np.array([g if g >= 0 else -100 for g in gt])
        return np.sum(np.where(np.abs(pred - gt) < thresh, 1., 0.)) / len(gt)

    @staticmethod
    def bench(pred, gt, y_samples, running_time):
        if any(len(p) != len(y_samples) for p in pred):
            raise Exception('Format of lanes error.')
        if running_time > 200 or len(gt) + 2 < len(pred):
            return 0., 0., 1.
        angles = [LaneEval.get_angle(np.array(x_gts), np.array(y_samples)) for x_gts in gt]
        threshs = [LaneEval.pixel_thresh / np.cos(angle) for angle in angles]
        line_accs = []
        fp, fn = 0., 0.
        matched = 0.
        for x_gts, thresh in zip(gt, threshs):
            accs = [LaneEval.line_accuracy(np.array(x_preds), np.array(x_gts), thresh) for x_preds in pred]
            max_acc = np.max(accs) if len(accs) > 0 else 0.
            if max_acc < LaneEval.pt_thresh: # 如果一张图片中最准确的车道线达不到阈值,则认为这张图片是FN
                fn += 1
            else:
                matched += 1
            line_accs.append(max_acc)
        fp = len(pred) - matched
        if len(gt) > 4 and fn > 0:
            fn -= 1
        s = sum(line_accs)
        if len(gt) > 4:
            s -= min(line_accs)
        return s / max(min(4.0, len(gt)), 1.), fp / len(pred) if len(pred) > 0 else 0., fn / max(min(len(gt), 4.) , 1.)

    @staticmethod
    def bench_one_submit(pred_file, gt_file):
        try:
            json_pred = [json.loads(line) for line in open(pred_file).readlines()]
        except BaseException as e:
            raise Exception('Fail to load json file of the prediction.')
        json_gt = [json.loads(line) for line in open(gt_file).readlines()]
        if len(json_gt) != len(json_pred):
            raise Exception('We do not get the predictions of all the test tasks')
        gts = {l['raw_file']: l for l in json_gt}
        accuracy, fp, fn = 0., 0., 0.
        for pred in json_pred:
            if 'raw_file' not in pred or 'lanes' not in pred or 'run_time' not in pred:
                raise Exception('raw_file or lanes or run_time not in some predictions.')
            raw_file = pred['raw_file']
            pred_lanes = pred['lanes']
            run_time = pred['run_time']
            if raw_file not in gts:
                raise Exception('Some raw_file from your predictions do not exist in the test tasks.')
            gt = gts[raw_file]
            gt_lanes = gt['lanes']
            y_samples = gt['h_samples']
            try:
                a, p, n = LaneEval.bench(pred_lanes, gt_lanes, y_samples, run_time)
            except BaseException as e:
                raise Exception('Format of lanes error.')
            accuracy += a
            fp += p
            fn += n
        num = len(gts)
        # the first return parameter is the default ranking parameter
        return json.dumps([
            {'name': 'Accuracy', 'value': accuracy / num, 'order': 'desc'},
            {'name': 'FP', 'value': fp / num, 'order': 'asc'},
            {'name': 'FN', 'value': fn / num, 'order': 'asc'}
        ])


if __name__ == '__main__':
    import sys
    try:
        if len(sys.argv) != 3:
            raise Exception('Invalid input arguments')
        print LaneEval.bench_one_submit(sys.argv[1], sys.argv[2])
    except Exception as e:
        print e.message
        sys.exit(e.message)
标注数据格式
“ label_data_(date).json”中的每条json行都是此剪辑的最后(第20帧)的标签数据。
格式
{
‘raw_file’: str. 剪辑中的第20帧文件路径。
‘lanes’: list. 车道列表。 对于一个车道的每个列表,元素是图像上宽度方向的值。
‘h_samples’: list. 对应于“车道”的高度值的列表,这意味着len(h_samples)== len(lanes [i])
}
实际上,车道中最多会有5个车道标记。 我们预计最多有4条车道标记(当前车道和左/右车道)。 更改车道时会使用额外的车道(第5条),因为它会混淆以哪个车道为当前车道。
折线以相同的距离间隔(每个标签数据中的“ h_sample”)进行组织。 这意味着您可以将一个lanes中的每个元素与h_samples配对,以获取车道线标记在图像上的位置。
此外,车道围绕视线中心,我们鼓励自动驾驶汽车将注意力集中在当前车道和左/右车道上。 这些车道对于汽车的控制至关重要。
例如:
{
“lanes”: [
[-2, -2, -2, -2, 632, 625, 617, 609, 601, 594, 586, 578, 570, 563, 555, 547, 539, 532, 524, 516, 508, 501, 493, 485, 477, 469, 462, 454, 446, 438, 431, 423, 415, 407, 400, 392, 384, 376, 369, 361, 353, 345, 338, 330, 322, 314, 307, 299],
[-2, -2, -2, -2, 719, 734, 748, 762, 777, 791, 805, 820, 834, 848, 863, 877, 891, 906, 920, 934, 949, 963, 978, 992, 1006, 1021, 1035, 1049, 1064, 1078, 1092, 1107, 1121, 1135, 1150, 1164, 1178, 1193, 1207, 1221, 1236, 1250, 1265, -2, -2, -2, -2, -2],
[-2, -2, -2, -2, -2, 532, 503, 474, 445, 416, 387, 358, 329, 300, 271, 241, 212, 183, 154, 125, 96, 67, 38, 9, -2, -2, -2, -2, -2, -2, -2, -2, -2, -2, -2, -2, -2, -2, -2, -2, -2, -2, -2, -2, -2, -2, -2, -2],
[-2, -2, -2, 781, 822, 862, 903, 944, 984, 1025, 1066, 1107, 1147, 1188, 1229, 1269, -2, -2, -2, -2, -2, -2, -2, -2, -2, -2, -2, -2, -2, -2, -2, -2, -2, -2, -2, -2, -2, -2, -2, -2, -2, -2, -2, -2, -2, -2, -2, -2]
],
“h_samples”: [240, 250, 260, 270, 280, 290, 300, 310, 320, 330, 340, 350, 360, 370, 380, 390, 400, 410, 420, 430, 440, 450, 460, 470, 480, 490, 500, 510, 520, 530, 540, 550, 560, 570, 580, 590, 600, 610, 620, 630, 640, 650, 660, 670, 680, 690, 700, 710],
“raw_file”: “path_to_clip”
}
lanes中的-2,意味着在某些h_sample上,没有对应的车道标记。 第一条车道中的第一个现有点是(632,280)。
评估
对于片段的每个预测,请以相同格式的标签数据组织结果。 另外,您需要根据test_tasks.json中的h_samples输出lanes以进行评估。 这意味着我们将评估特定图像高度上的点。
格式
{
‘raw_file’: str. 剪辑中的第20帧文件路径。
‘lanes’: list. 车道列表。 对于一个车道的每个列表,元素是图像上宽度方向的值。
‘run_time’: list of float. 剪辑中每一帧的运行时间。 单位是毫秒。
}
请记住,我们希望在车道(当前车道和左/右车道)中最多有4/5车道标记。 更改车道时,可以随意输出额外的左车道标记或右车道标记。 我们仅接受提交的车道数量不大于地面真实车道数量加2。例如,如果某个图像的地面真实车道数量为4,而您提交了7个车道,则 该图像为0。因此,请提交最有信心的车道。 此外,地面真车道的最大车道数最多为4条,有些为5条。
评估公式如下:
a c c u r a c y = ∑ c l i p C c l i p ∑ c l i p S c l i p accuracy = \frac{\sum_{clip} C_{clip}}{\sum_{clip} S_{clip}} accuracy=∑clipSclip∑clipCclip
其中 C c l i p C_{clip} Cclip 是clip最后一帧中正确点的数量, S c l i p S_{clip} Sclip 是clip最后一帧中所请求的点的数量。 如果地面真相的宽度与预测之间的差小于阈值,则预测点是正确的点。 如果您看不见某个点,或者没有某些特定h_sample的车道标记,只需将检测记录为-2。 我们将评估h_sample中所有高度的值。
根据上面的公式,我们还将为您的测试结果计算FP和FN。 FP表示该车道是预测的,但与地面真车道中的任何车道都不匹配。 FN表示该车道位于地面真相中,但与预测中的任何车道都不匹配。
F P = F p r e d N p r e d FP = \frac{F_{pred}}{N_{pred}} FP=NpredFpred F N = M p r e d N g t FN = \frac{M_{pred}}{N_{gt}} FN=NgtMpred
其中 F p r e d F_{pred} Fpred 是错误的预测车道数, N p r e d N_{pred} Npred是所有预测的车道数。 M p r e d M_{pred} Mpred 是预测中错过的地面真车道数量, N g t N_{gt} Ngt是所有地面真车道数量。
我们还需要从您的算法中运行时间。 我们不按运行时间进行排名。 但是,太慢的算法(例如使用单个GPU的速度低于5 fps)将被视为没有预测车道线。
每张图片的原始尺寸是1280x720个像素大小。