深度学习中matplotlib的使用看我就够啦
我认为matplotlib这个库会用,能够满足日常深度学习中的需求就行
陆续补充更新。。。。。。
目录
- 1.折线图
- 2.散点图
- 3.柱状图
1.折线图
plt.figure()创建显示的图框,第一个参数是几个图框,第二个是图框的大小
import matplotlib.pyplot as plt
plt.figure(1, figsize=(10, 5))  //创建第一个窗口
plt.figure(2, figsize=(1, 5))  //创建第二个窗口
plt.show()

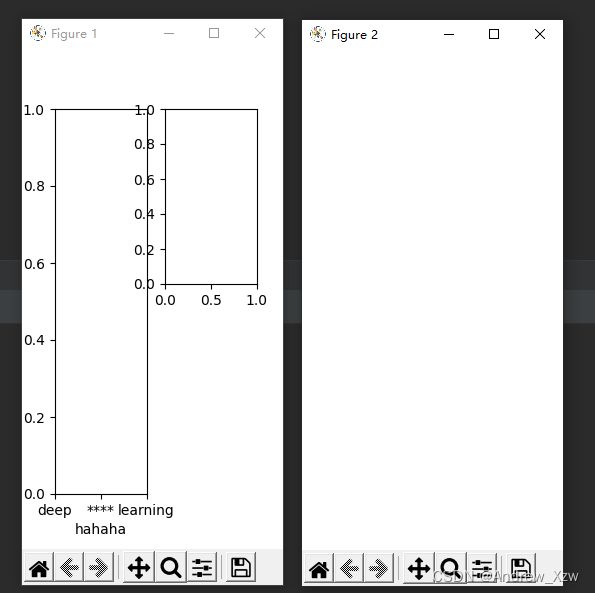
plt.subplot()在当下的图框中创建子图,
plt.xlabel()和plt.ylabel()分别设置x轴、y轴标签
plt.xticks()和plt.yticks()将x轴、y轴对用刻度的位置换成我们想要设置的label
import matplotlib.pyplot as plt
plt.figure(1, figsize=(10, 5))
plt.subplot(1, 2, 1)
plt.xlabel("hahaha")
plt.xticks([0, 0.5, 1], ["deep", "***", "learning"]) //将原图图x轴的0、0.5、1刻度处换成我们的label
plt.subplot(1, 2, 2)
plt.figure(2, figsize=(1, 5))  //第二个图框下没有创建子图,所以show出来以后还是空白
plt.show()
plt.title()当下子图标签
plt.plot()绘制线图,参数:自变量x,对应函数y的值,以及线的颜色和label值(用于显示图例)
plt.legend() 将图例在show出来的时候显示出来
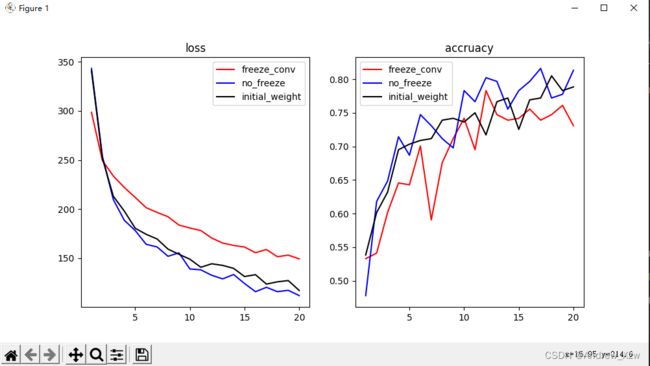
plt.figure(1, figsize=(10, 5))
plt.subplot(1, 2, 1)
plt.title("loss")  //第一个图框下的第一个子图标题

plt.plot(x, loss_file_no_fc_freeze_value, color='red', label='freeze_conv')
plt.plot(x, loss_no_fc, color='blue', label='no_freeze')
plt.plot(x, ResNet_loss_list_value, color='black', label='initial_weight')
plt.legend()   //这是显示图例,在plot画图中设置不同的label,就会根据每条线显示出图例
下面是我在训练深度学习模型时,通过字典文件将每一个epoch的loss和accuracy记录下来,并用matplotlib可视化出来
plt.figure(1, figsize=(10, 5))  //第一个图框figure1
//第一个子图
plt.subplot(1, 2, 1)
plt.title("loss") //标题
plt.xlabel("num of epoch") //x轴标签
plt.ylabel("value of loss")  //y轴标签
plt.xticks([5, 10, 15, 20], ["A", "B", "C", "D"])  //将原图中5, 10, 15, 20刻度处换成我们的label
plt.plot(x, loss_file_no_fc_freeze_value, color='red', label='freeze_conv')
plt.plot(x, loss_no_fc, color='blue', label='no_freeze')
plt.plot(x, ResNet_loss_list_value, color='black', label='initial_weight')
plt.legend() //根据plot绘图中每个线的color和label显示图例
#
//第二个子图
plt.subplot(1, 2, 2)
plt.title("accruacy")
plt.plot(x, accuracy_file_no_fc_freeze, color='red', label='freeze_conv')
plt.plot(x, accuracy_file_no_fc, color='blue', label='no_freeze')
plt.plot(x, ResNet_accuracy_list_value, color='black', label='initial_weight')
plt.legend()
plt.show()


