MLOps极致细节:3. MLFlow Tracking 案例代码解读
MLOps极致细节:3. MLFlow Tracking 案例代码解读
MLflow Tracking是一个API以及包含UI界面,能够允许我们记录代码中的log matrics和artifacts文件,查看运行历史记录,并且进行一些结果的数据可视化。
上一章节中,我们对MLflow Tracking的概念进行了描述(参见MLOps极致细节:2. MLFlow Tracking 介绍)。这里我们将对代码进行详细解读。
文章目录
- MLOps极致细节:3. MLFlow Tracking 案例代码解读
-
- 1 案例代码
- 2 案例代码解释
-
- 2.1 `experiment`相关
- 2.2 `run`相关
- 2.3 `tag`相关
- 2.4 `log`相关
- 3 Tracking UI 可视化结果
这里我们基于MLFlow的官方案例,写了一个例子:mlflow_tracking_ex.py。此案例的目的在于测试MLFlow Tracking API内的一些函数,包括:
- experiment的创建以及状态返回
- run task的创建,状态返回以及删除
- 日志相关,包括
log_metric,log_param,log_artifacts
除此之外,基于log_metric记录的数据,我们可以在MLFlow UI平台中进行可视化展示。
1 案例代码
mlflow_tracking_ex.py的核心代码如下:
# Create an experiment name, which must be unique and case sensitive
experiment_id = create_experiment("mlflowTrackingExample2")
experiment = get_experiment(experiment_id)
print("Name: {}".format(experiment.name))
print("Experiment_id: {}".format(experiment.experiment_id))
print("Artifact Location: {}".format(experiment.artifact_location))
print("Tags: {}".format(experiment.tags))
print("Lifecycle_stage: {}".format(experiment.lifecycle_stage))

# 启动一个新的MLflow run task
with start_run(experiment_id=experiment_id) as parent_run:
    set_tag("test.release", "1.1.0-RC")     # 添加一个tag
    log_param("parent", "yes")              # 第一种Log形式:Log parameters
    log_param("param1", randint(0, 100))

    for epoch in range(0, 20):              # 第二种Log形式:Log metric
        log_metric(key="quality", value=2*epoch, step=epoch)

    if not os.path.exists("outputs"):
        os.makedirs("outputs")
    with open("outputs/test.txt", "w") as f:
        f.write("hello world!")
    log_artifacts("outputs")                # 第三种Log形式:Log artifacts

run_id = parent_run.info.run_id
#delete_run(run_id)     # If you want to visualize the matric results, do not delete this run.

print("run_id: {}; lifecycle_stage: {}".format(run_id, get_run(run_id).info.lifecycle_stage))
当我们运行mlflow_tracking_ex.py后,我们发现,系统自动生成了文件夹mlruns,内部的文件结构如下:
-- 0/1/2/...  ### This is experiment id
  -- 31b023f8f5d844c79e2a6ce024d5cf5d  ### This is run id
    -- artifacts
      -- test.txt
    -- metrics
      -- quality
    -- params
      -- param1
      -- parents
    -- tags
      -- mlflow.source.git.commit
      -- mlflow.source.name
      -- mlflow.source.type
      -- mlflow.user
      -- test.release
    -- meta.yaml
  -- meta.yaml
2 案例代码解释
2.1 experiment相关
我们通过mlflow.create_experiment()来创建一个新的experiment,返回experiment_id。而这个id就是mlruns文件夹下新生成的文件夹的名字。此外,通过函数get_experiment,可以返回这个experiment相关的状态,比如在我们这个例子中:
print("Name: {}".format(experiment.name))
# -> 返回mlflowTrackingExample2。此参数就是create_experiment的输入。
print("Experiment_id: {}".format(experiment.experiment_id))
# -> 返回2。如果默认的情况,每次运行一个experiment,其id会比上一次运行加1。
print("Artifact Location: {}".format(experiment.artifact_location))
# 返回 file:///D:/XXX/XXX/mlflow-ex/ex/mlflow-tracking/mlruns/2
print("Tags: {}".format(experiment.tags))
# 当前返回 {},因为我们在代码中只是新建了一个experiment,其他啥还没干。
print("Lifecycle_stage: {}".format(experiment.lifecycle_stage))
# 返回 active。
2.2 run相关
我们通过运行with start_run(experiment_id=experiment_id) as parent_run:启动了一个新的run任务。一般来说,我们先新建experiment,然后再新建run任务。在自动生成的文件夹中,experiment id的文件夹下,就是run id的文件夹。run id可以通过parent_run.info.run_id返回。除此之外,我们可以通过delete_run(run_id)来删除正在运行的run任务。但需要注意的是,一旦停止了run任务,那么MLFlow UI就无法可视化metric结果了。
2.3 tag相关
我们可以通过mlflow.set_tag()来新建tag。除此之外,系统在运行程序后,还自动生成了mlflow.source.git.commit,mlflow.source.name,mlflow.source.type,mlflow.user这些tag。这些tag都被保存在tags文件夹下。
2.4 log相关
首先是log_param函数。我们在代码中尝试了log_param("parent", "yes"),log_param("param1", randint(0, 100))。运行代码后,我们发现在params文件夹下多了一个param1文件和parent文件。里面的值分别为62与yes。所以我们可以看到log_param的方式是一个参数一个文件,里面包含了这个参数的值。然后是log_metric函数。之所以之前的章节中我将metric解释为矩阵,是因为这个日志保存的形式就像一个矩阵一样。我们在代码中使用了一个for循环:
for epoch in range(0, 20):              # 第二种Log形式:Log metric
    log_metric(key="quality", value=2*epoch, step=epoch)
运行代码后,我们在metrics文件夹下生成了一个quality的文件,内容如下:
1645859588036 0 0
1645859588042 2 1
1645859588047 4 2
1645859588052 6 3
1645859588056 8 4
1645859588061 10 5
1645859588065 12 6
1645859588070 14 7
1645859588076 16 8
1645859588081 18 9
1645859588086 20 10
1645859588091 22 11
1645859588095 24 12
1645859588100 26 13
1645859588104 28 14
1645859588110 30 15
1645859588114 32 16
1645859588119 34 17
1645859588124 36 18
1645859588129 38 19
这些数据的行数应该等同于for循环的次数,而第一列应对应时间,第二列对应数据(value),第三列应对应step。在MLFlow UI中,也可以自动生成可视化的曲线图。在下一章节中呈现。最后是log_artifacts函数。它的作用是记录一个本地的文件或者路径。在代码中,我们先生成了outputs/test.txt文件,然后将这个文件又保存到了artifacts文件夹下。
除此之外,系统还生成了2个meta.yaml文件,一个在mlrun文件夹下,一个在run id文件夹下。
mlrun文件夹下meta.yaml文件:
artifact_location: file:///D:/XXX/XXX/mlflow-ex/ex/mlflow-tracking/mlruns/2
experiment_id: '2'
lifecycle_stage: active
name: mlflowTrackingExample2
它其实保存的就是get_experiment(最后运行的experiment)的一些返回值。
run id文件夹下meta.yaml文件:
artifact_uri: file:///D:/XXX/XXX/mlflow-ex/ex/mlflow-tracking/mlruns/2/31b023f8f5d844c79e2a6ce024d5cf5d/artifacts
end_time: 1645859630219
entry_point_name: ''
experiment_id: '2'
lifecycle_stage: active
name: ''
run_id: 31b023f8f5d844c79e2a6ce024d5cf5d
run_uuid: 31b023f8f5d844c79e2a6ce024d5cf5d
source_name: ''
source_type: 4
source_version: ''
start_time: 1645859630070
status: 3
tags: []
user_id: gugut
这里记录的信息就是每一个run对应的一些meta-data。
3 Tracking UI 可视化结果
我们在terminal中运行mlflow ui。(注意,我们在terminal中,需要在运行mlflow_tracking_ex.py的目录下运行mlflow ui,否则webservice打开后会找不到任何experiment的记录)
当我们输入mlflow ui之后,terminal会显示INFO:waitress:Serving on http://127.0.0.1:5000。我们打开这个IP地址,会显示如下图:

在上图左边栏,我们能看到experiment的记录。每一栏的命名其实就是experiment id的名字(experiment.name的返回值)。我们选择mlflowTrackingExample2,然后会发现页面底部Showing match run多出来一行。这一行就是刚才我们run task的信息。
我们先不点进去,而是看一下这个Showing match run的每一列,包含了:Start Time, Duration, Run Name, Models, Metrics(包括quality), Parameters(包括param1和parent), test.release.
当我们点进去:
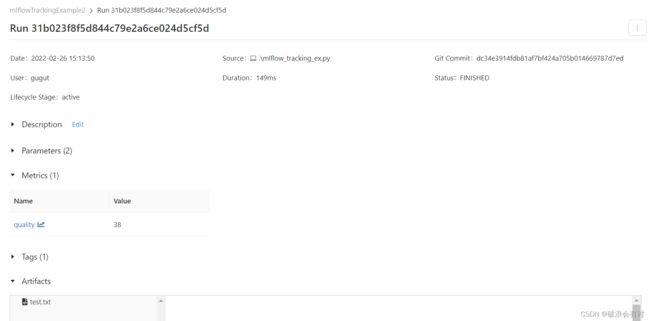
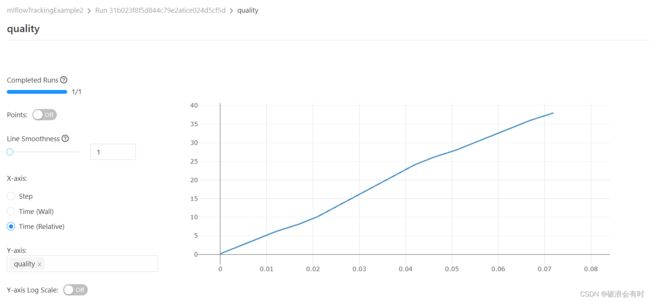
你会发现,其实MLFlow就是给我们做了一个比较简单的前端界面。这个界面里,我们能直观地看到mlruns保存的各种种类的数据。31b023f8f5d844c79e2a6ce024d5cf5d就是run id的值。当我们点击quality(log metrics我们定义了一个参数叫quality),我们看到,MLFlow给我们画了图,横坐标可以是时间,也可以是index,由于我们在保存metric数据的时候保存了index:log_metric(key="quality", value=2*epoch, step=epoch)。
在未来的案例中,我们会频繁使用到mlflow ui以及日志的记录,非常有用。