sklearn学习06——PCA
sklearn学习06——PCA
- 前言
- 一、PCA的核心思想
-
- 1.1、PCA的原理
- 1.2、PCA的大致流程
- 1.3、样本信息量的衡量
- 二、sklearn实现PCA过程
-
- 2.1、引入相关库
- 2.2、利用PCA降维
- 2.3、不同主成分个数对应的可解释方差分析(Explained Variance)
- 总结
前言
主成分分析(principal component analysis)是一种常见的数据降维方法,其目的是在“信息”损失较小的前提下,将高维的数据转换到低维,从而减小计算量。本篇简单介绍PCA的思想,然后继续使用sklearn实现它。一、PCA的核心思想
1.1、PCA的原理
PCA的本质就是找一些投影方向,使得数据在这些投影方向上的方差最大,而且这些投影方向是相互正交的。这其实就是找新的正交基的过程,计算原始数据在这些正交基上投影的方差,方差越大,就说明在对应正交基上包含了更多的信息量。如果特征值较小,则说明数据在这些特征向量上投影的信息量很小,我们就可以将小特征值对应方向的数据删除,从而达到了降维的目的。
1.2、PCA的大致流程
PCA 所要做的工作,简单点说,就是对原始的空间中顺序地找一组相互正交的坐标轴,第一个轴是使得方差最大的,第二个轴是在与第一个轴正交的平面中使得方差最大的,第三个轴是在与第1、2个轴正交的平面中方差最大的,这样假设在 N 维空间中,我们可以找到 N 个这样的坐标轴,我们取前 r 个去近似这个空间,这样就从一个 N 维的空间压缩到 r 维的空间了,但是我们选择的 r 个坐标轴能够使得空间的压缩使得数据的损失最小。
因此,关键点就在于:如何找到新的投影方向使得原始数据的“信息量”损失最少
1.3、样本信息量的衡量
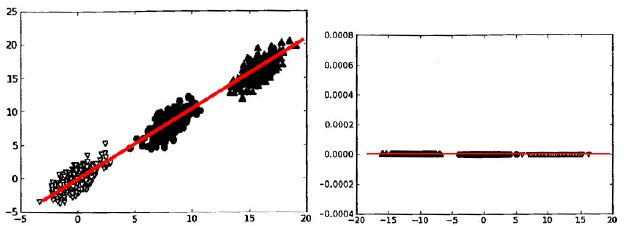
样本的“信息量”指的是样本在特征方向上投影的方差。方差越大,则样本在该特征上的差异就越大,因此该特征就越重要。以《机器学习实战》上的图说明,在分类问题里,样本的方差越大,越容易将不同类别的样本区分开。

二、sklearn实现PCA过程
2.1、引入相关库
代码如下:
# 添加目录到系统路径方便导入模块,该项目的根目录为".../machine-learning-toy-code"
import sys
from pathlib import Path
curr_path = str(Path().absolute())
parent_path = str(Path().absolute().parent)
p_parent_path = str(Path().absolute().parent.parent)
sys.path.append(p_parent_path)
print(f"主目录为:{p_parent_path}")
from torch.utils.data import DataLoader
from torchvision import datasets
import torchvision.transforms as transforms
import matplotlib.pyplot as plt
import numpy as np

from sklearn.decomposition import PCA
import numpy as np
import matplotlib.pyplot as plt
2.2、利用PCA降维
这里是将图片形式的样本,使用PCA对其特征维数降维。
代码如下:
train_dataset = datasets.MNIST(root = p_parent_path+'/datasets/', train = True,transform = transforms.ToTensor(), download = False)
test_dataset = datasets.MNIST(root = p_parent_path+'/datasets/', train = False,
                               transform = transforms.ToTensor(), download = False)

batch_size = len(train_dataset)
train_loader = DataLoader(dataset=train_dataset, batch_size=batch_size, shuffle=True)
test_loader = DataLoader(dataset=test_dataset, batch_size=batch_size, shuffle=True)
X_train,y_train = next(iter(train_loader))
X_test,y_test = next(iter(test_loader))
X_train,y_train = X_train.cpu().numpy(),y_train.cpu().numpy() # tensor转为array形式)
X_test,y_test = X_test.cpu().numpy(),y_test.cpu().numpy() # tensor转为array形式)
X_train = X_train.reshape(X_train.shape[0],784)
X_test = X_test.reshape(X_test.shape[0],784)
m , p = X_train.shape # m:训练集数量,p:特征维度数
print(f"原本特征维度数:{p}") # 特征维度数为784

# n_components是>=1的整数时,表示期望PCA降维后的特征维度数
# n_components是[0,1]的数时,表示主成分的方差和所占的最小比例阈值,PCA类自己去根据样本特征方差来决定降维到的维度
model = PCA(n_components=0.95)
lower_dimensional_data = model.fit_transform(X_train)
print(f"降维后的特征维度数:{model.n_components_}")
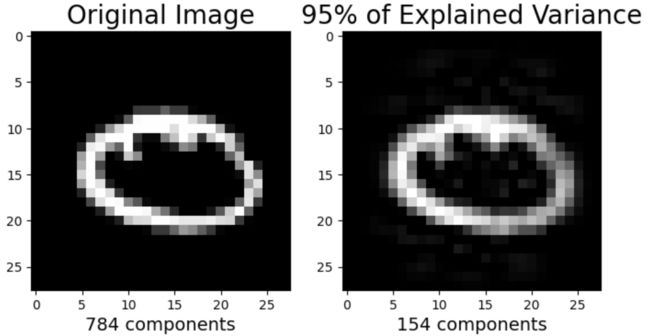
下面将样本还原,观察一下降维前后的样本是否保持着差不多的信息量。
approximation = model.inverse_transform(lower_dimensional_data) # 降维后的数据还原
plt.figure(figsize=(8,4));

# 原始图片
plt.subplot(1, 2, 1);
plt.imshow(X_train[1].reshape(28,28),
              cmap = plt.cm.gray, interpolation='nearest',
              clim=(0, 1));
plt.xlabel(f'{X_train.shape[1]} components', fontsize = 14)
plt.title('Original Image', fontsize = 20)
# 降维后的图片
plt.subplot(1, 2, 2);
plt.imshow(approximation[1].reshape(28, 28),
              cmap = plt.cm.gray, interpolation='nearest',
              clim=(0,1));
plt.xlabel(f'{model.n_components_} components', fontsize = 14)
plt.title('95% of Explained Variance', fontsize = 20)
plt.show()
2.3、不同主成分个数对应的可解释方差分析(Explained Variance)
model = PCA() # 这里需要分析所有主成分,所以不降维
model.fit(X_train)
tot = sum(model.explained_variance_)
var_exp = [(i/tot)*100 for i in sorted(model.explained_variance_, reverse=True)]
cum_var_exp = np.cumsum(var_exp)
plt.figure(figsize=(10, 5))
plt.step(range(1, p+1), cum_var_exp, where='mid',label='cumulative explained variance') # p:特征维度数
plt.title('Cumulative Explained Variance as a Function of the Number of Components')
plt.ylabel('Cumulative Explained variance')
plt.xlabel('Principal components')
plt.axhline(y = 95, color='k', linestyle='--', label = '95% Explained Variance')
plt.axhline(y = 90, color='c', linestyle='--', label = '90% Explained Variance')
plt.axhline(y = 85, color='r', linestyle='--', label = '85% Explained Variance')
plt.legend(loc='best')
plt.show()
def explained_variance(percentage, images):
    '''
       :param: percentage [float]: 降维的百分比
       :return: approx_original: 降维后还原的图片
       :return: model.n_components_: 降维后的主成分个数
    '''
    model = PCA(percentage)
    model.fit(images)
    components = model.transform(images)
    approx_original = model.inverse_transform(components)
    return approx_original,model.n_components_
plt.figure(figsize=(8,10));
percentages = [784,0.99,0.95,0.90]
for i in range(1,5):
    plt.subplot(2,2,i)
    im, n_components = explained_variance(percentages[i-1], X_train)
    im = im[5].reshape(28, 28) # 重建成图片
    plt.imshow(im,cmap = plt.cm.gray, interpolation='nearest',clim=(0,1))
    plt.xlabel(f'{n_components} Components', fontsize = 12)
    if i==1:
        plt.title('Original Image', fontsize = 14)
    else:
        plt.title(f'{percentages[i-1]*100}% of Explained Variance', fontsize = 14)
plt.show()
总结
我们使用sklearn内部的PCA方法实现了一个简单的降维操作,但是如果想要按照PCA算法手写一套自己的PCA方法,可以根据以下几个步骤来:
- 去除平均值
- 计算协方差矩阵
- 计算协方差矩阵的特征值和特征向量
- 将特征值从大到小排序
- 保留最上面的N个特征向量
- 将数据转换到上述N个特征向量构建的新空间中
PCA在众多降维算法中(例如因子分析、独立主成分分析、流行学习等)使用最为广泛,降维后我们就可以使用更简单的分类器或者得到更好的分类间隔解决分类问题了。


