python数据分析(七)—pandas数据可视化
常见图的绘制
常使用的语法有:
x和y:表示标签或者位置,用来指定显示的索引,默认为None。
kind:表示绘图的类型,默认为line,折线图。
subplots:是否对列分别作子图,默认False
title:图形的标题
grid:图形是否有网格,默认None
color:对颜色的设置
stacked:是否堆积,在折线图和柱状图中默认为False,在区域图中默认为True
先对一份水果数据的读取:
frame = pd.read_csv('fruit.csv', encoding='utf-8') # 数据转为utf-8编码
frame
# 输出为
  month	apple	banana	peach
0	Jan	300	     310	190
1	Feb	320      320	264
2	Mar	310	     330	247
3	Apr	245	     345	315
4	May	340	     350	285
5	Jun	289	     326	346
6	Jul	340	     378	145
7	Aug	317	     352	265
8	Sep	356	     249	218
9	Oct	346	     342	312
10	Nov	346	     259	170
11	Dec	346	     298	256
1. 柱形图bar
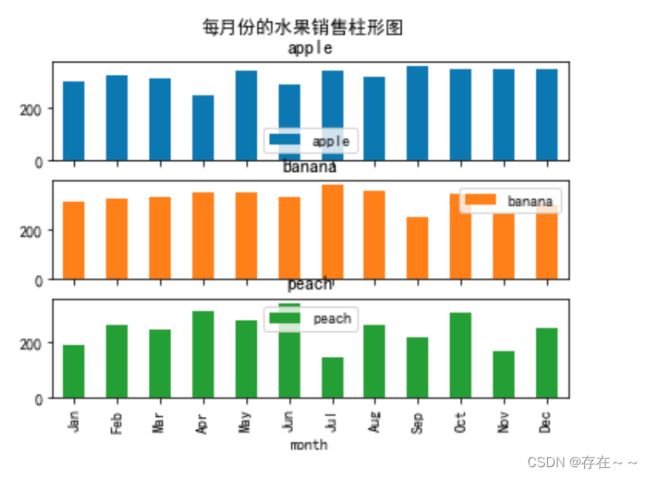
- 将上述数据中三种水果在一个张图分开绘制成柱形子图
import matplotlib.pyplot as plt
plt.rcParams['font.sans-serif']=['SimHei'] #用来正常显示中文标签
plt.rcParams['axes.unicode_minus']=False #用来正常显示负号

# kind='bar'图形类型为柱形图,subplots制作子图
df.plot(kind='bar',
        x = 'month',
       y=['apple', 'banana','peach'],
        #分别作子图
        subplots=True,
        title='年份的水果销售柱形图'
       )
# plt.show()
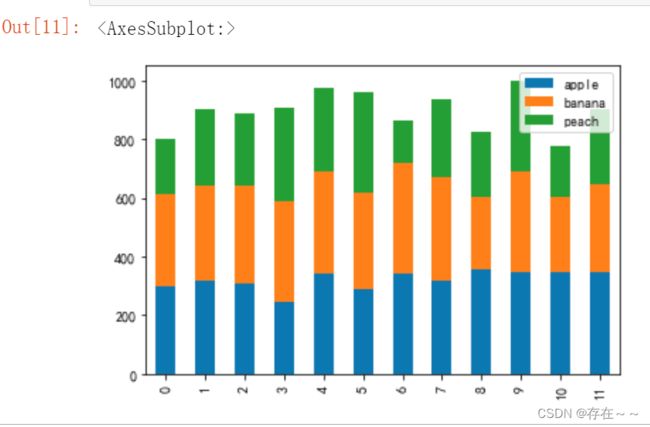
- 将三种水果绘制成一张重叠的柱形图
frame.plot(kind=‘bar’, stacked=True) # stacked设置重叠区域
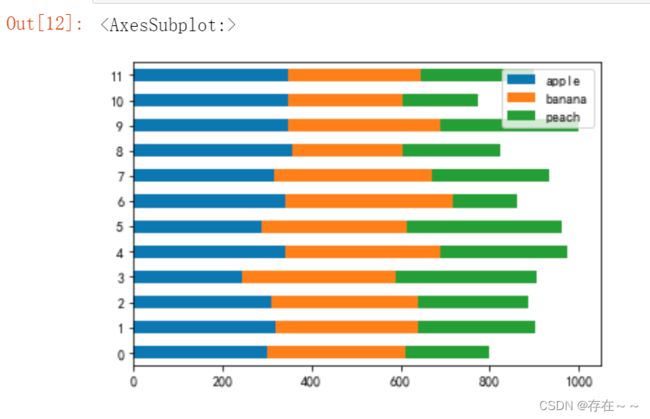
- 水平绘制重叠的柱形图
frame.plot(kind=‘barh’, stacked=True) # 柱状图barh是水平方向制作
2. 折线图line
pandas默认为绘制折线图。
- 绘制折线图的基本操作
1.图像标记:使用关键字参数marker来标记每个点plt.plot(x, y, marker=‘*’ ) # 用星号来标记点
- 线的类型:linestyle可以缩写成ls,plt.plot(x, y, ls = ‘-’ )
虚线dashed:ls = ‘:’
直线dotted:ls = ‘-’
虚线还可以写成ls = ‘–’
斜点:ls = ‘-.’ - 线条颜色:plt.plot(x, y, color = ‘red’),color可以缩写成c
- 线宽:plt.plot(x, y, linewidth = ‘数字’)
- 标签和标题:x轴名plt.xlabel(“XX”)、y轴名plt.ylabel(“XX”)、标题plt.title(“XX”)
- 设置标签和标题的字体属性:用参数fontdict来为xlabel()、ylabel()和title()设置字体属性
plt.title(“XX”, fontdict=xx)
xx可以写成xx = {‘family’ : ‘serif’, ‘color’ : ‘bule’, ‘size’ : 20} - 标题的定位:用参数loc来对标题的定位
plt.title(“XX”, loc = ‘left’) 靠左侧是left,靠右侧是right,中间是center(默认值) - 添加网格线:plt.grid() 默认x和y都有网格线
显示x轴的网格线:plt.grid(axis = ‘x’)、axis = 'y’显示y轴、axis = 'both’显示x和y轴
设置网格线的属性:plt.grid(color = ‘XX’, linestyle = ‘XX’, linewidth = ‘XX’) - 子图:用subplots()可以在一张图中绘制多张图
plt.subplots(x, y, z) 参数x,y对应行和列、z表示当前绘图的索引,用x,y,z三个参数来描绘图形的布局。
子图里面添加标题和上述方法一样plt.title(“XX”),在各自生成子图的代码中使用该方法。
子图里面添加大标题方法为plt.suptitle(“XX”)
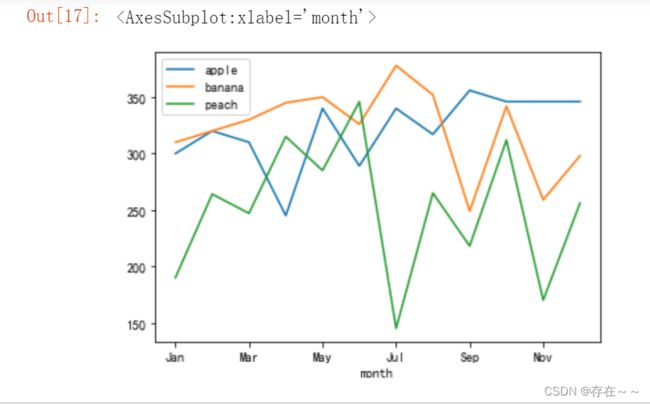
将上述水果绘制成折线图:
frame.plot() # pandas默认绘制折线图
frame.plot(y='peach') # 设置参数绘制自己想要的数据
frame.plot(x='month', y='apple') # 根据需求设置好x和y轴
frame.plot(kind='line', x = 'month', y = ['apple', 'banana', 'peach'])
用一个数据更多的DataFrame来绘制成折线图
frame = pd.DataFrame(np.random.randn(1000, 2), columns=['B', 'C']).cumsum()
frame["A"] = pd.Series(list(range(1000))) # range是python内置函数,通过设置为一组Series来添加进去DataFrame中的列项
# frame['A'] = range(1000)
# frame
frame.plot(x="A", y = "B")
pandas.DataFrame.cumsum()方法
cumsum(axis=1):当axis=1时,是按列累加和的
cumsum(axis=0):当axis=0时按行(或者说索引 Index)累加和
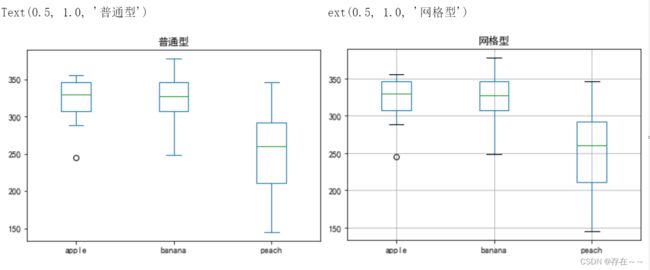
3. 箱型图box
将上述水果绘制成箱型图
frame.plot(kind='box', x='month', y = ['apple', 'banana', 'peach'])
frame.plot.box() # 也可以按照默认,不设置x和y、不设置kind参数,等价于frame.plot(kind='box')
frame.boxplot()  # 绘制带有网格的箱型图
4. 散点图scatter
将上述水果绘制成散点图:
用kind参数和不用kind参数的写法
frame.plot.scatter(x='month', y='banana')
frame.plot(kind='scatter', x='month', y='banana')

在散点图上修改散点的形状和颜色
frame.plot(kind='scatter', x='month', y='banana', color='red', marker="*", s=100)
# marker 为设置散点形状,s为设置散点大小
5.其它图
其它图像有:
pie:饼状图
hist:直方图(数值频率分布)
kde:密度图,主要对柱状图添加
Kernel 概率密度线
area:区域图(面积图)
hexbin:蜂巢图
