MAC解决Python绘图中文无法显示问题
一、问题解析
问题说明:电脑上安装了Python3.8,最近遇到绘图,无法将中文标签显示,显示为空白方框。

原因:matplotlib默认的字体为英文字体,导致许多unicode编码的语言文字都无法书写。
python中没有自带的中文字体,我们可以通过修改自己的配置实现中文显示。
二、前期准备
1.首先先了解一下Python常用中文字体对应名称:
| 名称 | 字体 |
|---|---|
| 黑体 | SimHei |
| 微软雅黑 | Microsoft YaHei |
| 微软正黑体 | Microsoft JhengHei |
2.首先查看自己的字体文件的位置,一般都是在/Library/Frameworks/Python.framework/Versions/3.8/lib/python3.8/site-packages/matplotlib/mpl-data/fonts/ttf/目录下。
可以使用命令进行查看:
import matplotlib.pyplot as plt
from matplotlib import font_manager

for font in font_manager.fontManager.ttflist:
    # 查看字体名以及对应的字体文件名
    print(font.name, '-', font.fname)
运行程序,可以看到两个路径:
- Python安装的时候,自带的字体,默认没有中文字体,我们针对此路径进行字体补充;
- 最后是MAC电脑中的字体,代码中可以通过指定字体的方式,完成中文展示(另外注意,此路径有权限设置,如作修改,需要输入MAC自己的密码。进行赋权)。

三、具体操作
我们针对第一个地址进行修改,进入对应路径进行修改配置。一共分为三步:
步骤1:下载对应中文字体,放置在字体文件夹里;
步骤2:修改对应配置文件matplotlibrc,为matplotlib的配置文件;
步骤3:删除系统缓存,重新开启程序,运行测试。
步骤1:下载字体Simhei.ttf
(网上会有很多资源,直接下载即可,先是资源已存在,我就不上传了。)
步骤2:修改文件matplotlibrc
修改前:
# font.family:  sans-serif     # 249行

# font.sans-serif: DejaVu Sans, Bitstream Vera Sans, Computer Modern Sans Serif, Lucida Grande, Verdana, Geneva, Lucid, Arial, Helvetica, Avant Garde, sans-serif       # 257行

# axes.unicode_minus: True  # use Unicode for the minus symbol rather than hyphen.  See
                           # https://en.wikipedia.org/wiki/Plus_and_minus_signs#Character_codes   # 400行
修改后:
# 249行,去掉注释
font.family:  sans-serif

# 257行,同样去掉注释,并添加Simhei字体,根据自己实际字体进行添加
font.sans-serif: Simhei, DejaVu Sans, Bitstream Vera Sans, Computer Modern Sans Serif, Lucida Grande, Verdana, Geneva, Lucid, Arial, Helvetica, Avant Garde, sans-serif

# 400行,去掉注释,并修改值为False
axes.unicode_minus: False  # use Unicode for the minus symbol rather than hyphen.  See
                           # https://en.wikipedia.org/wiki/Plus_and_minus_signs#Character_codes
步骤3.删除缓存
首先查看自己电脑上的缓存路径:
import matplotlib
print(matplotlib.get_cachedir())
我自己电脑上地址为:/Users/xxxx/.matplotlib,直接进入目录删除即可。(以自己实际的为准)

之后重新开启工具,就可以直接使用了。
# 导入第三方模块
import matplotlib.pyplot as plt
# 构造数据
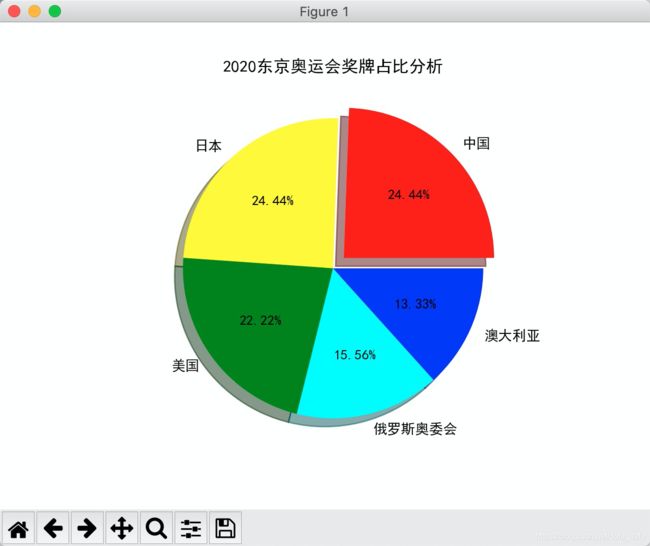
value = [11,11,10,7,6]
labels = ['中国','日本','美国','俄罗斯奥委会','澳大利亚']
colors=['red','yellow','green','cyan','blue'] # 自定义颜色
# 绘制饼图
plt.pie(
x = value, # 绘图数据
labels=labels, # 添加标签
colors=colors, # 设置饼图的自定义填充色
autopct='%.2f%%', # 设置百分比的格式,这里保留2位小数
explode=[0.1,0,0,0,0],# 突出显示中国
shadow=True,
textprops = {'fontsize':10, 'color':'black'}, # 设置文本标签的属性值
)
# 添加图标题
plt.title('2020东京奥运会奖牌占比分析')
# 显示图形
plt.show()
四、拓展
其他方式:MAC中本身自带了很多字体,可以代码中直接使用系统字体。
1.首次查看电脑中已有的所有字体.
from matplotlib.font_manager import FontManager
fm = FontManager()
mac_fonts = set(f.name for f in fm.ttflist)
print(mac_fonts)
结果显示如下:
2.字体展示如上,可以直接选用一个字体用于代码中指定。示例代码如下:
import matplotlib.pyplot as plt
# 指定字体
plt.rcParams['font.sans-serif']=['Arial Unicode MS']
# plt.rcParams['axes.unicode_minus']=False
# 构造数据
# 截止2021.7.28下午数据
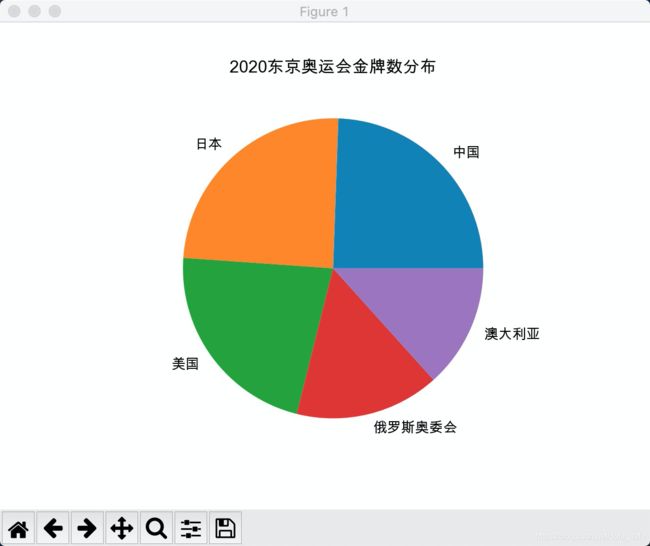
Value = [11,11,10,7,6]
labels = ['中国','日本','美国','俄罗斯奥委会','澳大利亚']
# 绘制饼图
plt.pie(
x = Value, # 绘图数据
labels=labels, # 添加教育水平标签
)
plt.title('2020东京奥运会金牌数分布')
# 显示图形
plt.show()
展示如下: