matplotlib,seaborn等画图工具
文章目录
- matplotlib
-
-
- 引入包
-
- 基础操作
-
- 设置画图
- 画直线
- 画出多张图
- 曲线图
- 子图
- 饼图
- 直方图
- 散点图
- 折线图
- 三维图
- 表格图
-
- seaborn
-
-
- FacetGrid
-
- 加载数据集
- boxplot
- boxenplot
- swarmplot
- pointplot
- heatmap
- histplot
- barplot
- pairplot
- catplot
-
matplotlib
只会讲解常用参数,并不会将每个方法的所有参数,需要某些参数的可以根据链接直接阅读官方的API文档
可能在matplotlib中看到我使用seaborn画图,这是因为seaborn比较好看,一些图就在matplotlib上讲解
引入包
import matplotlib.pyplot as plt
基础操作
设置画图
#设置画图的大小
#宽20,高10
plt.figure(figsize=(20,10))

#设置x,y轴范围,[left,right]
plt.xlim(left,right)
plt.ylim(left,right)
画直线
#画水平线
plt.axhline(y=0.5, color='r', linestyle='-')
#画竖直线
plt.axvline(x=0.5, color='r', linestyle='-')
plt.show()
画出多张图
#设置画布大小
f = plt.figure(figsize=(20,10))
#画出一个2行1列的图,这个位于第一个位置
f.add_subplot(2,1,1)
sns.barplot()
f.add_subplot(2,1,2)
sns.barplot()
曲线图
官方地址
matplotlib.pyplot.plot(*args, scalex=True, scaley=True, data=None, **kwargs)
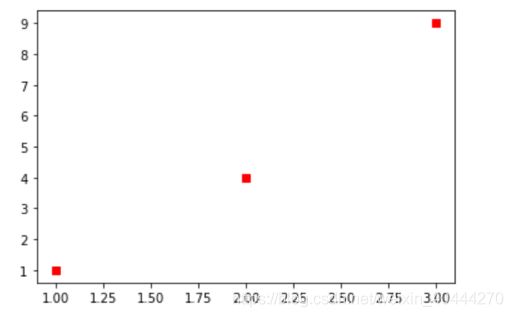
>>> plt.plot([1, 2, 3], [1, 2, 3], 'go-', label='line 1', linewidth=2)
- 这里 ‘go’:表示 green circle
- ‘-’:表示是直线
- 第一个字母颜色缩写,第二个字母是点的类型,第三个字母表示线
>>> plot([1, 2, 3], [1, 4, 9], 'rs', label='line 2')
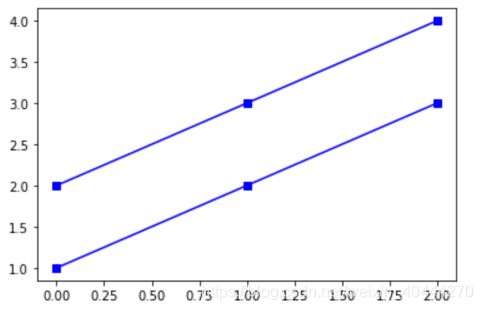
>>> plot([[1,2],[2,3],[3,4]], 'bs-', label='line 3')
子图
就是在一张图上显示多张图
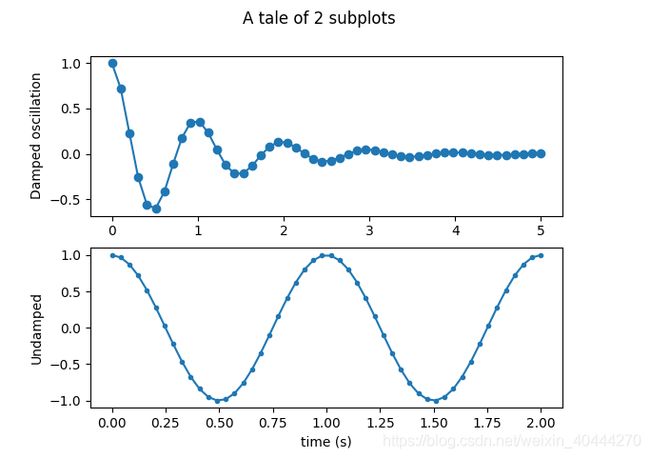
- 两张子图
x1 = np.linspace(0.0, 5.0)
x2 = np.linspace(0.0, 2.0)

y1 = np.cos(2 * np.pi * x1) * np.exp(-x1)
y2 = np.cos(2 * np.pi * x2)

#设置母图和子图,ax1,ax2显示在fig中,这里设置为两行一列的格局展示
fig, (ax1, ax2) = plt.subplots(2, 1)
#设置标题
fig.suptitle('A tale of 2 subplots')

#可以随意设置你要画的图,折线图、散点图等等
ax1.plot(x1, y1, 'o-')
ax1.set_ylabel('Damped oscillation')

ax2.plot(x2, y2, '.-')
ax2.set_xlabel('time (s)')
ax2.set_ylabel('Undamped')

plt.show()
饼图
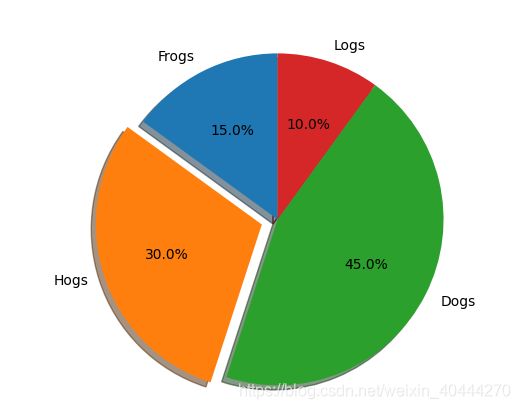
Pie chart, where the slices will be ordered and plotted counter-clockwise:
labels = 'Frogs', 'Hogs', 'Dogs', 'Logs'
sizes = [15, 30, 45, 10]

#这是代表饼图各部分的突出情况,值越大,扇形区域离中心点越远
explode = (0, 0.1, 0, 0)  # only "explode" the 2nd slice (i.e. 'Hogs')

fig1, ax1 = plt.subplots()

#autopct:表示饼图数据显示的格式
#shadow:是否显示阴影,有阴影看起来更好看一点
#startangle:start-angle,第一个label:Frogs的旋转角度
#colors:设置自己所需要的颜色,可以使用rgb的十六进制位进行设置 colors = ["red","green","blue","#FFB6C1"]
ax1.pie(sizes, explode=explode, labels=labels, autopct='%1.1f%%',
        shadow=True, startangle=90,colors=colors)
ax1.axis('equal')  # 表示为圆形

plt.show()
直方图
散点图
seaborn.scatterplot(*, x=None, y=None, hue=None, style=None, size=None, data=None, palette=None, hue_order=None, hue_norm=None, sizes=None, size_order=None, size_norm=None, markers=True, style_order=None, x_bins=None, y_bins=None, units=None, estimator=None, ci=95, n_boot=1000, alpha=None, x_jitter=None, y_jitter=None, legend='auto', ax=None, **kwargs)
官方文档链接
折线图
三维图
表格图
data = [[ 66386, 174296,  75131, 577908,  32015],
        [ 58230, 381139,  78045,  99308, 160454],
        [ 89135,  80552, 152558, 497981, 603535],
        [ 78415,  81858, 150656, 193263,  69638],
        [139361, 331509, 343164, 781380,  52269]]

columns = ('Freeze', 'Wind', 'Flood', 'Quake', 'Hail')
rows = ['%d year' % x for x in (100, 50, 20, 10, 5)]

values = np.arange(0, 2500, 500)
value_increment = 1000

# 设置颜色的渐变,读者可以自行实验,一般取值为0.5-1
colors = plt.cm.BuPu(np.linspace(0, 0.5, len(rows)))
n_rows = len(data)

index = np.arange(len(columns)) + 0.3
bar_width = 0.4  #设置矩形宽度

# Initialize the vertical-offset for the stacked bar chart.
y_offset = np.zeros(len(columns))

# Plot bars and create text labels for the table
cell_text = []
for row in range(n_rows):
    plt.bar(index, data[row], bar_width, bottom=y_offset, color=colors[row])
    y_offset = y_offset + data[row]
    cell_text.append(['%1.1f' % (x / 1000.0) for x in y_offset])
# Reverse colors and text labels to display the last value at the top.
colors = colors[::-1]
cell_text.reverse()

# Add a table at the bottom of the axes
the_table = plt.table(cellText=cell_text,
                      rowLabels=rows,
                      rowColours=colors,
                      colLabels=columns,
                      loc='bottom')

# Adjust layout to make room for the table:
plt.subplots_adjust(left=0.2, bottom=0.2)

plt.ylabel("Loss in ${0}'s".format(value_increment))
plt.yticks(values * value_increment, ['%d' % val for val in values])
plt.xticks([])
plt.title('Loss by Disaster')

plt.show()
seaborn
在此基础进行编辑,详情链接https://blog.csdn.net/weixin_42398658/article/details/82960379
seaborn本来是再matplotlib的基础上进行美化,所有一些基础设置可以使用matplotlib或者两者相结合
FacetGrid
加载数据集
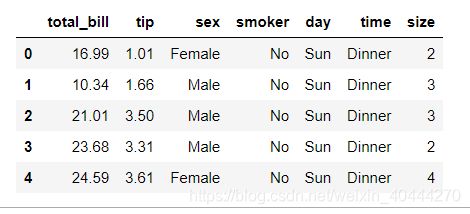
这个数据集主要是根据total_bill,sex,smoker,day,time,size来预测一下tip为多少(我认为)
tips = sns.load_dataset("tips")
tips.head()
- total_bill :总账单
- sex:性别
- smoker:是否抽烟
- day:星期几
- time:早餐午餐晚餐
- size:人数
- tip:小费
class seaborn.FacetGrid(data, row=None, col=None, hue=None, col_wrap=None, sharex=True, sharey=True, height=3, aspect=1, palette=None, row_order=None, col_order=None, hue_order=None, hue_kws=None, dropna=True, legend_out=True, despine=True, margin_titles=False, xlim=None, ylim=None, subplot_kws=None, gridspec_kws=None, size=None)
-
data:DataFrame
必须是DataFrame类型,每一列都是一个变量(特征),每一行是一个样本 -
row、col、hue:string
定义数据子集的变量,这些变量在网格的不同方面绘制。参考下面*_order参数来控制该变量的级别 例如:col="Sex",hue="smoker",即列表示性别,颜色语义表示是否吸烟 -
col_wrap:int,此变量选填
图网格列维度的限制,col_wrap = 3,那么画布最多画3列,行不做限制
-
share{x,y}:bool,‘col’,‘row’ 此变量选填
是否共享x轴或者y轴,如果为真,就共享同一个轴,否则就不共享,默认都共享,即为True
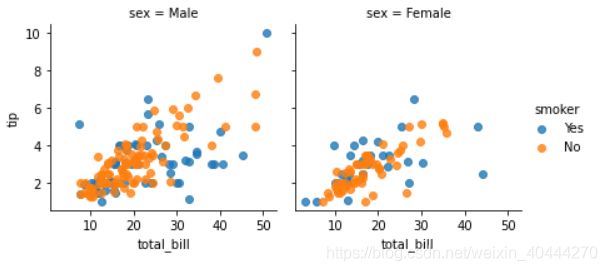
#两列为性别取值:Male和Female
#hue为smoker
g = sns.FacetGrid(tips, col="sex", hue="smoker",sharex=True, sharey=True)# 共享x轴和y轴
#类型为散点图,横轴为属性"total_bill",纵轴为tip,alpha表示颜色透明度,1最深,0最浅
g.map(plt.scatter, "total_bill", "tip", alpha=0.8)
#为每个图标添加标注,比如右下角的smoker
g.add_legend();
g = sns.FacetGrid(tips, col="sex", hue="smoker",sharex=True, sharey=False)# 关闭共享y轴
g.map(plt.scatter, "total_bill", "tip", alpha=0.8)
g.add_legend();
g = sns.FacetGrid(tips, row="time",col="sex", hue="smoker",sharex=True, sharey=True)# 都共享
g.map(plt.scatter, "total_bill", "tip", alpha=0.8)
g.add_legend();
-
height:scalar,选填
设置每个图片高度,默认为3 -
aspect:scalar,选填
每个小图的横轴长度和纵轴的比,此值越大则横轴越长
g = sns.FacetGrid(tips, col="sex", hue="smoker",sharex=True, sharey=True, aspect=2) # 默认为1,即等高等宽,
g.map(plt.scatter, "total_bill", "tip", alpha=0.8)
g.add_legend();
-
palette:palette name,list,or dict,选填
颜色的风格,可以使用内置选好的风格:deep, muted, bright, pastel, dark, colorblind
#添加参数palett,可以设置为列表['red','blue'],列表也可使用rgb的十六进制,;例如palette=['#FFB6C1','red']
#下图用的palette=['#FFB6C1','red']
g = sns.FacetGrid(tips, col="sex", hue="smoker",sharex=True, sharey=True, aspect=2,palette='muted')
-
{row,col,hue}_order:list.可选
设置显示顺序
#col_order 就是设置col值的现实顺序,图片与此代码并不对应
g = sns.FacetGrid(tips, col="sex", hue="smoker",sharex=True, sharey=True,col_order=['老大', '老二', '老三', '老四'])
g.map(plt.scatter, "total_bill", "tip", alpha=0.8)
g.add_legend();
-
hue_kws:
其他关键字参数插入到绘图调用中,让其他绘图属性在色相变量的级别上有所不同(例如散点图中的标记)
也就是快速辨识
#定义字典,确认颜色
pal = dict(Lunch="green",Dinner="red")
g = sns.FacetGrid(tips,col="sex",hue="time",palette=pal,hue_order=["Dinner","Lunch"])
g = (g.map(plt.scatter,"total_bill","tip")).add_legend()
pal = dict(Lunch="green",Dinner="red")
#hue_kws设置显示标记
g = sns.FacetGrid(tips, col="sex", hue="time", palette=pal,hue_order=["Dinner", "Lunch"], hue_kws=dict(marker=["^", "v"]))
g = (g.map(plt.scatter,"total_bill","tip")).add_legend()
-
legend_out:bool,可选
默认为True
就是在图中显示图例,结合下图即可知道
pal = dict(Lunch="green",Dinner="red")
g = sns.FacetGrid(tips, col="sex", hue="time", palette=pal,hue_order=["Dinner", "Lunch"],legend_out=False)
g.map(plt.scatter,"total_bill","tip")
boxplot
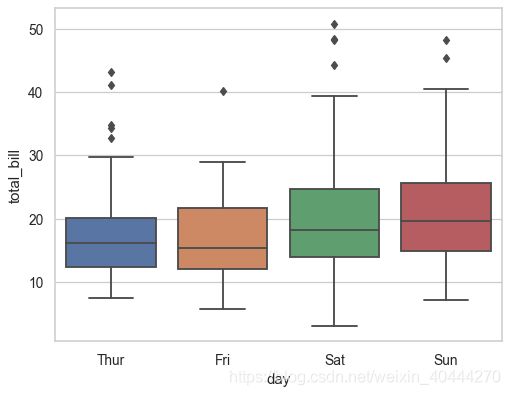
”盒式图”或“盒须图"(也称为Box-whiskerPlot)
- 提供有关数据位置和分散情况的关键信息,尤其在比较不同的母体数据时更可表现其差异

seaborn.boxplot(*, x=None, y=None, hue=None, data=None, order=None, hue_order=None, orient=None, color=None, palette=None, saturation=0.75, width=0.8, dodge=True, fliersize=5, linewidth=None, whis=1.5, ax=None, **kwargs)
- x,y,hue:data中的变量或者是一个向量数据类型,可选
- data:DataFrame,array,或者list of array,可选
画图的数据来源 - order,hue_order:lists of strings,可选
设置顺序 - orient:“v”/“h”,可选
设置图的显示是垂直或者水平方向 - color:设置颜色
- palette:palette name,list,或者dict
设置颜色主题,可以自行使用list设置颜色集 - whis:float,可选
设置IQR的范围,不懂的话点击此链接的箱型图那栏 - linewidth:float
设置画线的宽度 - saturation:float
设置颜色的饱和度,1的时候最鲜艳 - fliersize:float
异常值菱形的大小 - 剩下一些可以自己试验,我觉得没啥用需要的自己看,官方文档链接在下列图片最后
举例
import seaborn as sns
sns.set_theme(style="whitegrid")
tips = sns.load_dataset("tips")
ax = sns.boxplot(x=tips["total_bill"])
ax = sns.boxplot(x="day", y="total_bill", data=tips)
ax = sns.boxplot(x="day", y="total_bill", hue="smoker",
                 data=tips, palette="Set3")
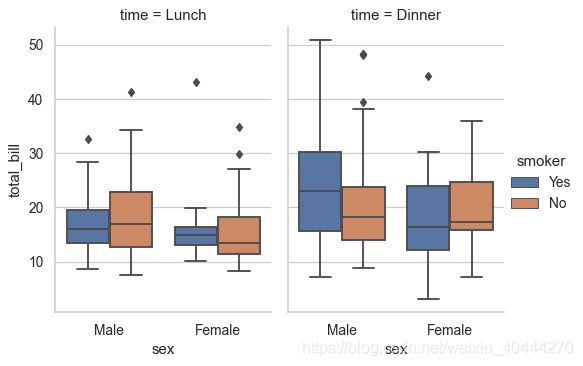
g = sns.catplot(x="sex", y="total_bill",
                hue="smoker", col="time",
                data=tips, kind="box",
                height=4, aspect=.7);
ax = sns.boxplot(x="day", y="total_bill", data=tips)
ax = sns.swarmplot(x="day", y="total_bill", data=tips, color=".25")
boxenplot
与boxplot非常相似,是增强型的箱图

增强箱图又称增强盒形图,可以为大数据集绘制增强的箱图。

增强箱图通过绘制更多的分位数来提供数据分布的信息。、
seaborn.boxenplot(*, x=None, y=None, hue=None, data=None, order=None, hue_order=None, orient=None, color=None, palette=None, saturation=0.75, width=0.8, dodge=True, k_depth='tukey', linewidth=None, scale='exponential', outlier_prop=0.007, trust_alpha=0.05, showfliers=True, ax=None, **kwargs)
swarmplot
画一个没有重叠点的分类散点图
swarmplot官方文档
seaborn.swarmplot(*, x=None, y=None, hue=None, data=None, order=None, hue_order=None, dodge=False, orient=None, color=None, palette=None, size=5, edgecolor='gray', linewidth=0, ax=None, **kwargs)
参数
- 参数也没啥可介绍的
示例
import seaborn as sns
sns.set_theme(style="whitegrid")
tips = sns.load_dataset("tips")
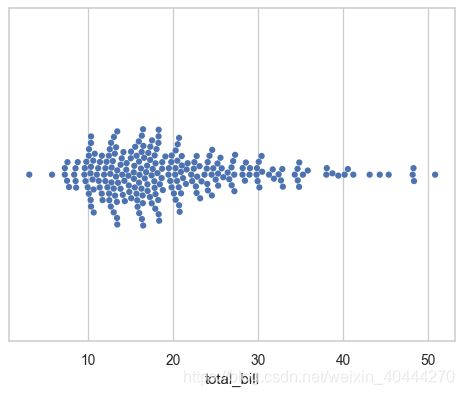
ax = sns.swarmplot(x=tips["total_bill"])
ax = sns.swarmplot(x="day", y="total_bill", data=tips)
ax = sns.swarmplot(x="day", y="total_bill", hue="sex", data=tips)
pointplot
pointplot,如其名,就是点图。点图代表散点图位置的数值变量的中心趋势估计,并使用误差线提供关于该估计的不确定性的一些指示。
点图比条形图在聚焦一个或多个分类变量的不同级别之间的比较时更为有用。
点图尤其善于表现交互作用:一个分类变量的层次之间的关系如何在第二个分类变量的层次之间变化。
重要的一点是点图仅显示平均值(或其他估计值),但在许多情况下,显示分类变量的每个级别的值的分布可能会带有更多信息。
在这种情况下,其他绘图方法,例如箱型图或小提琴图可能更合适。
seaborn.pointplot(x=None, y=None, hue=None, data=None, order=None, hue_order=None,estimator=
参数
-
estimator:调用函数实现向量 -> 标量的映射
在每个分箱内进行估计的统计函数。 -
ci:float 或 “sd” 或 None
在估计值附近绘制置信区间的尺寸大小。如果是“sd”,则跳过引导阶段并绘制观察数据点的标准差。如果为 None,则不会执行引导过程,并且不会绘制误差块。 -
n_boot:int
计算置信区间时使用的引导迭代次数 -
units:data 或 vector data 中变量的名称
采样单元的标识符,用于执行多级引导过程(计算置信区间等)并能够处理重复测量的设定 -
markers:字符串或字符串列表
用于每个hue色调的级别的标记 -
linestyles:字符串或字符串列表
用于每个hue色调的级别的线条风格 -
join:bool:如果为True,则在hue级别相同的点估计值之间绘制线条
-
scale:float:绘图元素的比例因子
-
errwidth:float 误差线(和上下限指示线)的厚度
-
capsize:float 误差线“上下限指示线”的宽度
-
orient:“v”/“h”:垂直显示或者水平显示
-
palette:palette name,list or dict
设置颜色风格
示例
import seaborn as sns
sns.set_theme(style="darkgrid")
tips = sns.load_dataset("tips")
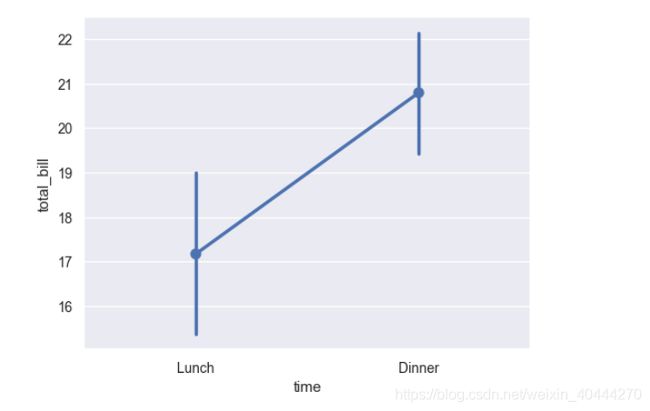
ax = sns.pointplot(x="time", y="total_bill", data=tips)
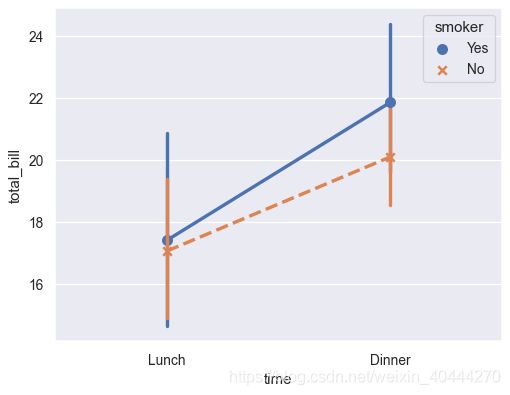
ax = sns.pointplot(x="time", y="total_bill", hue="smoker",
                   data=tips,
                   markers=["o", "x"],
                   linestyles=["-", "--"])
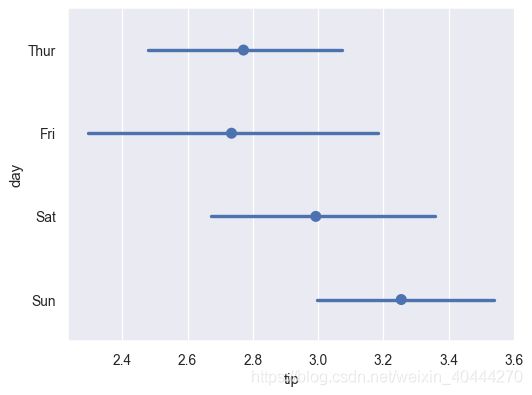
ax = sns.pointplot(x="tip", y="day", data=tips)
ax = sns.pointplot(x="tip", y="day", data=tips, join=False)
更多信息查看官方文档
heatmap
将feature之间的相关性可视化的方式展现出
heatmap的官方文档地址
seaborn.heatmap(data, *, vmin=None, vmax=None, cmap=None, center=None, robust=False, annot=None, fmt='.2g', annot_kws=None, linewidths=0, linecolor='white', cbar=True, cbar_kws=None, cbar_ax=None, square=False, xticklabels='auto', yticklabels='auto', mask=None, ax=None, **kwargs)
参数
- data:rectangle dataset
- 2维的narray数据,如果是pandas的DataFrame的类型那么index和column信息将会作为columns和rows
- vmin,vmax:floats,可选
- 设置范围,默认是[-1,1],自行试验
- annot:bool或者rectangular dataset,可选
- 图上显示相关性,默认不显示,根据颜色深浅进行判断
- linewidth:float,可选
- 每个小格之间的距离
- cbar:bool,默认为True
- 就是显示右边的色彩条
- fmt:str,可选
- 设置值的显示格式,例如:’.2f’等
- center:float,可选
- 在绘制发散数据时颜色映射的居中值。如果没有指定,使用此参数将更改默认的cmap
- cmap:颜色设置,可选
示例
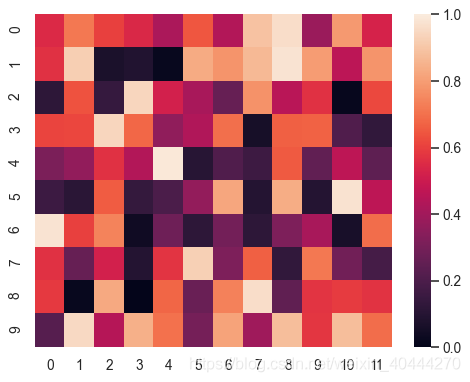
import numpy as np; np.random.seed(0)
import seaborn as sns; sns.set_theme()
uniform_data = np.random.rand(10, 12)
ax = sns.heatmap(uniform_data)
#设置vmin和vmax
ax = sns.heatmap(uniform_data, vmin=0, vmax=1)
histplot
官方文档
直方图
seaborn.histplot(data=None, *, x=None, y=None, hue=None, weights=None, stat='count', bins='auto', binwidth=None, binrange=None, discrete=None, cumulative=False, common_bins=True, common_norm=True, multiple='layer', element='bars', fill=True, shrink=1, kde=False, kde_kws=None, line_kws=None, thresh=0, pthresh=None, pmax=None, cbar=False, cbar_ax=None, cbar_kws=None, palette=None, hue_order=None, hue_norm=None, color=None, log_scale=None, legend=True, ax=None, **kwargs)
参数
- data:可视化的数据,DataFrame,ndarray等各种数据结构
- x,y :设置横轴和纵轴
- 若是不为y设置值,那么会可视化根据x轴划分的每个每段的个数
- hue:看示例
- kde:bool
- 若为True,则会画出一条拟合直方图的曲线
- fill:bool
- 默认为True,就是会填满颜色
- stat:{“count”, “frequency”, “density”, “probability”}
- 不设置y,这四种类型即为y的属性
- 每个bin的显示类型
- bins:str,number,vector,或者其他类型
- 若其类型为number,则将x轴的数据进行切分成bins块
- 若为vector类型,则按照vector进行划分
- shrink:number
- 设置直方的宽度,默认为1,超过1则是变宽,小于1则变窄
- multiple:{“layer”, “dodge”, “stack”, “fill”}
- 一般在设置hue之后再设置,这是四种风格,自行试验
- element:{“bars”, “step”, “poly”}
- 设置直方图的显示类型,默认是bars,读者自行试验
- legend:bool
- 默认为True,hue设置之后才有效,效果是示例第四张图
示例
- 默认为True,hue设置之后才有效,效果是示例第四张图
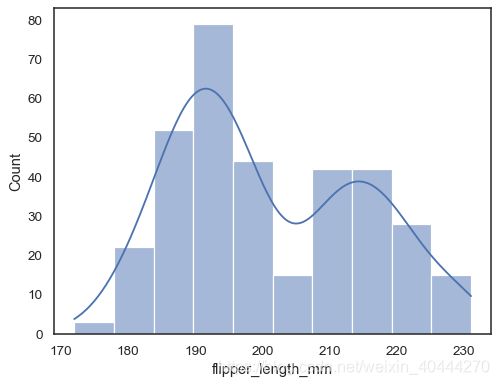
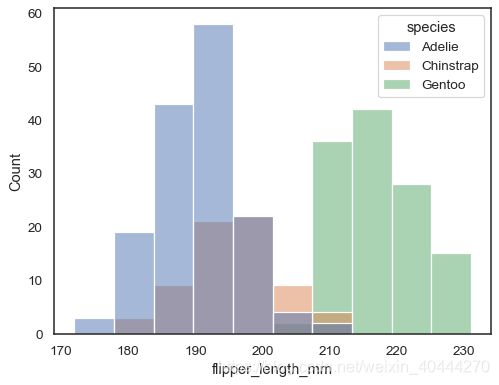
penguins = sns.load_dataset("penguins")
sns.histplot(data=penguins, x="flipper_length_mm")
sns.histplot(data=penguins, y="flipper_length_mm")
sns.histplot(data=penguins, x="flipper_length_mm", kde=True)
sns.histplot(data=penguins, x="flipper_length_mm", hue="species")
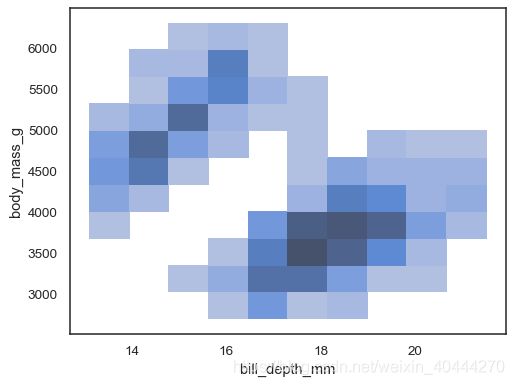
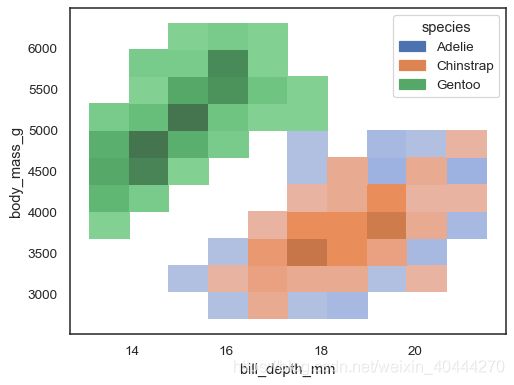
当x和y同时赋值的时候,就会类似于一个heatmap
sns.histplot(penguins, x="bill_depth_mm", y="body_mass_g")
sns.histplot(penguins, x="bill_depth_mm", y="body_mass_g", hue="species")
barplot
官方文档地址
条形图
seaborn.barplot(*, x=None, y=None, hue=None, data=None, order=None, hue_order=None, estimator=
参数
- x,y,hue
- data
- order,hue_order:设置顺序
- palette:设置颜色主题
- saturation:float,optional
- 设置颜色的鲜艳程度
- orient:“v”/“h”,optional
- 设置显示的方向,水平或者垂直
示例
- 设置显示的方向,水平或者垂直
import seaborn as sns
sns.set_theme(style="whitegrid")
tips = sns.load_dataset("tips")
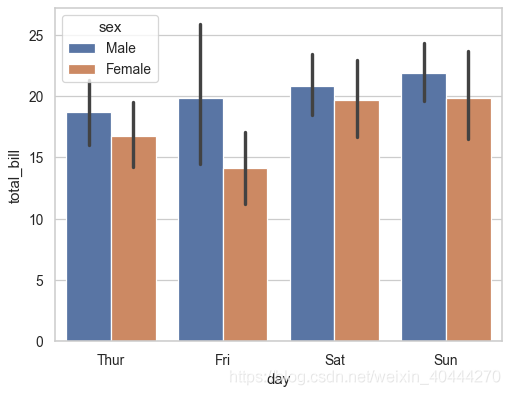
ax = sns.barplot(x="day", y="total_bill", data=tips)
ax = sns.barplot(x="day", y="total_bill", hue="sex", data=tips)
pairplot
seaborn.pairplot(data, *, hue=None, hue_order=None, palette=None, vars=None, x_vars=None, y_vars=None, kind='scatter', diag_kind='auto', markers=None, height=2.5, aspect=1, corner=False, dropna=False, plot_kws=None, diag_kws=None, grid_kws=None, size=None)
参数
与之前参数大同小异,不再细讲
seaborn.pairplot官方文档
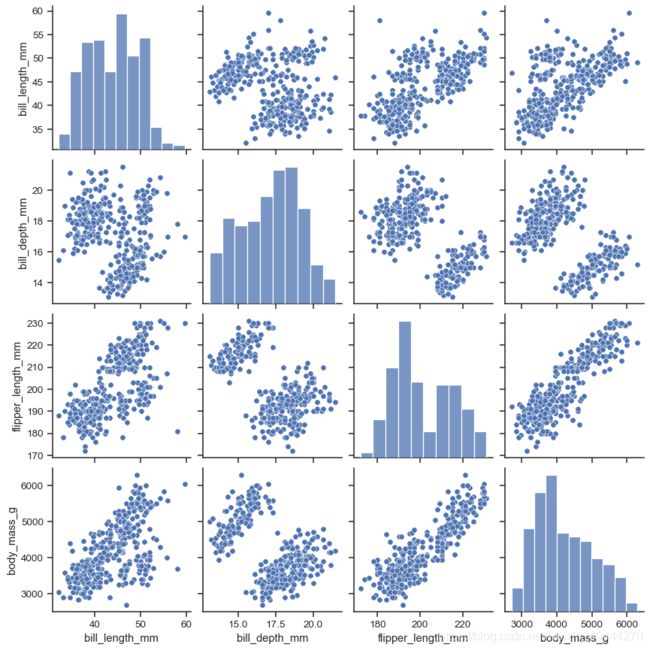
在数据集中绘制成对关系,
示例
更多示例到官方文档查看
#这个数据可能会引用失败,因为墙的原因,所有可以自行到github上Seaborn中下载
penguins = sns.load_dataset("penguins")
sns.pairplot(penguins)
对角线上是每个属性的数量分布图,其他表示两两feature之间的相关关系
sns.pairplot(penguins, hue="species")
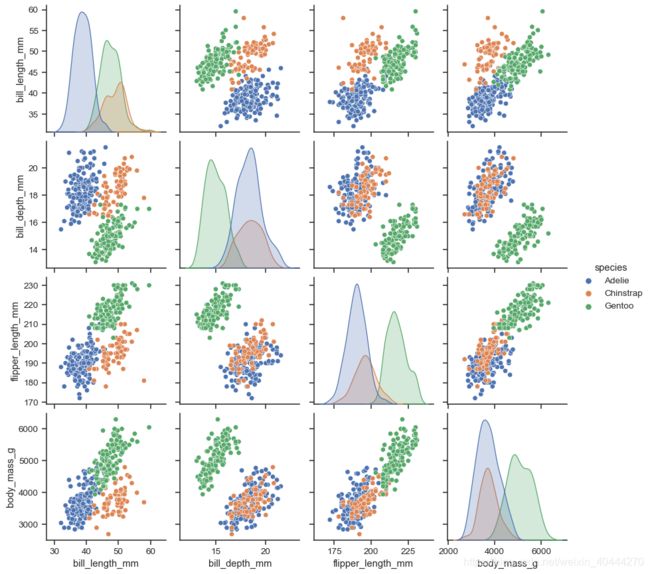
sns.pairplot(penguins, hue="species", diag_kind="hist")

catplot
seaborn.catplot(*, x=None, y=None, hue=None, data=None, row=None, col=None, col_wrap=None, estimator=


