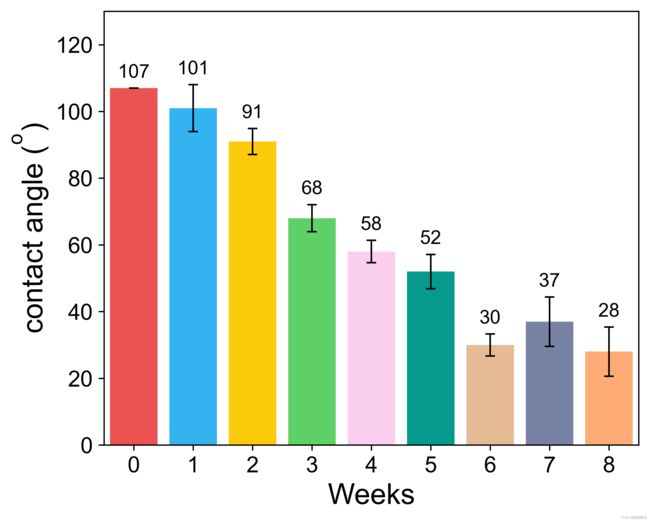
用python结合matplotlib包,绘制带有误差棒和数值的柱状图,每根柱子配色不同
工作需要,时不时需要画柱状图,但是origin画图时不时的有点崩溃,有时候破解版输出图还有水印,因此考虑用python一个脚本把平均值、标准差和绘图一次完成,每根柱子的配色都可以自己设置,每根柱子上面都有对应的数值,且随柱子高低排列。
P.S. origin柱子分别配色需要按住ctrl,同时点击对应柱子,设置颜色。
代码如下:
import matplotlib.pyplot as plt
import pandas as pd
import matplotlib.ticker as ticker

df=pd.read_excel('water contact summarize.xlsx', sheet_name='UV', header=0)
print(df)
std=df.groupby(by='week').std()  #标准差
mean=df.groupby(by='week').mean().round(0).astype('int32') #average,小数点后面没有数字,还需将float转为int,否则会有107.0 这种并非整数
mean.to_excel('mean.xlsx')
print(std)
print(mean)


font1={'family' : 'Arial', 'size'   : 12}
font2={'family' : 'Arial', 'size'   : 18}
tick_spacing=1

=============================================================================
fig1=plt.figure(dpi=96,figsize=(6,5))
ax1=plt.subplot(111)
error_params=dict(elinewidth=1,ecolor='black',capsize=3)#设置误差标记参数
plt.axis([-0.5,8.5,0,130]) #坐标轴范围
l1=plt.bar(mean.index, mean['10S-1'], color=['#EB5353','#34B3F1','#FBCB0A','#5FD068','#F9CEEE',"#069A8E", "#E6BA95", "#7882A4","#FFAB76"],yerr=std['10S-1'],\
           error_kw=error_params)

for i in range(0,9):
    plt.text(mean.index[i],mean['10S-1'][i]+std['10S-1'][i]+2,mean['10S-1'][i], ha='center',va='bottom',fontdict=font1,rotation=0)

ax1.set_xlabel('Weeks',font2)
ax1.set_ylabel('contact angle ($\mathregular{^o}$)',font2)
ax1.xaxis.set_major_locator(ticker.MultipleLocator(tick_spacing))
plt.tick_params(labelsize=14)
labels = ax1.get_xticklabels() + ax1.get_yticklabels()
[label.set_fontname('Arial') for label in labels]


# =============================================================================
#
# =============================================================================


fig2=plt.figure(dpi=96,figsize=(6,5))
ax2=plt.subplot(111)
error_params=dict(elinewidth=1,ecolor='black',capsize=3)#设置误差标记参数
plt.axis([-0.5,8.5,0,130]) #坐标轴范围
l1=plt.bar(mean.index, mean['10S-2'], color=['#EB5353','#34B3F1','#FBCB0A','#5FD068','#F9CEEE',"#069A8E", "#E6BA95", "#7882A4","#FFAB76"],yerr=std['10S-2'],\
           error_kw=error_params)

for i in range(0,9):
    plt.text(mean.index[i],mean['10S-2'][i]+std['10S-2'][i]+2,mean['10S-2'][i], ha='center',va='bottom',fontdict=font1,rotation=0)

#设置各个ax的坐标轴,lable,tick的字体大小等等
axvalue=locals()
for i in range(1,3):

    axvalue['ax'+str(i)].set_xlabel('Weeks',font2)
    axvalue['ax'+str(i)].set_ylabel('contact angle ($\mathregular{^o}$)',font2)
    axvalue['ax'+str(i)].xaxis.set_major_locator(ticker.MultipleLocator(tick_spacing))
    plt.tick_params(labelsize=14)
    labels = axvalue['ax'+str(i)].get_xticklabels() + axvalue['ax'+str(i)].get_yticklabels()
    [label.set_fontname('Arial') for label in labels]

fig1.savefig('contact angle after UV aging-10S-1.png',dpi=600,format='png',bbox_inches = 'tight')
fig2.savefig('contact angle after UV aging-10S-2.png',dpi=600,format='png',bbox_inches = 'tight')

plt.show()
print('Done!')
