Matlab画直方图

 1

2

3

4

5

6

7

8

9

10

11

12

13

14

15

16

17

18

19

20

%% 绘制统计直方图

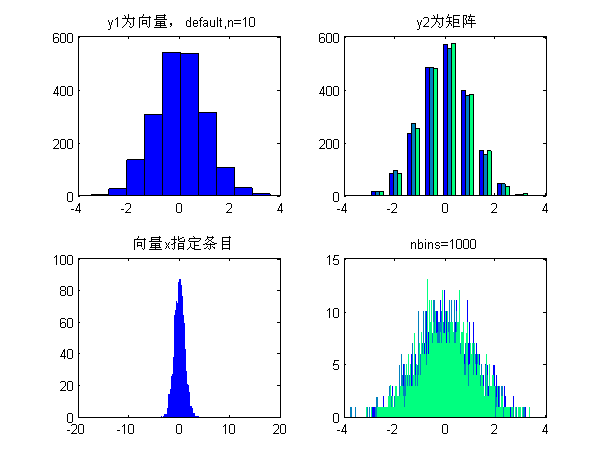
%hist(y):如果y是向量,则把其中元素放入10个条目中,且返回每条中的元素的个数;如果y为矩阵,则分别对每列进行处理,显示多组条形。

%[n,xout]=hist(y,x):非递减向量x的指定bin的中心。向量xout包含频率计数与条目的位置。

x=-10:.1:10;

y1=randn(2008,1);

y2=randn(2008,3);

figure;

colormap(winter);

subplot(2,2,1);

hist(y1);%把其中元素放入10个条目中

title('y1为向量,default,n=10');

subplot(2,2,2);

hist(y2);%分别对每列进行处理,显示多组条形

title('y2为矩阵');

subplot(2,2,3);

hist(y1,x);%用户也可以使用[n,xout]=hist(y1,x);bar(xout,n)绘制条形直方图

title('向量x指定条目');

subplot(2,2,4);

hist(y2,1000);%第二个参数为标量时指定bin的数目

title('nbins=1000');

Matlab画直方图_第1张图片

1

2

3

4

5

6

7

8

9

%% ========均值方差直方图========

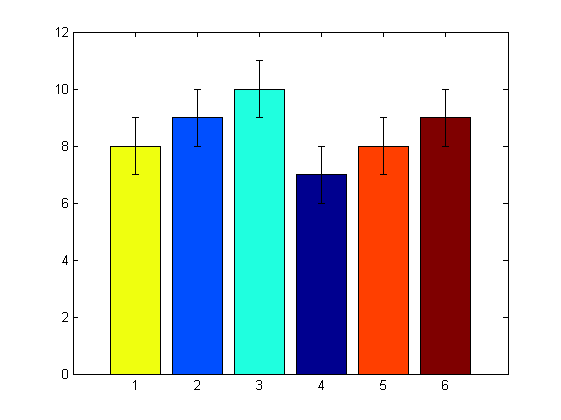
a=[8 9 10 7 8 9];%mean

b=[1 1 1 1 1 1];%std

figure();

h=bar(a);

ch=get(h,'children');

set(ch,'FaceVertexCData',[4;2;3;1;5;6]);%使用Indexed形式指定每组bar的颜色

hold on;

errorbar(a,b,'k','LineStyle','none');

Matlab画直方图_第2张图片

1

2

3

4

5

6

7

8

9

10

11

12

13

14

15

16

17

18

19

20

21

22

23

24

%% =======散点图scatter , scatter3 , plotmatrix======

%scatter3(X,Y,Z,S,C):在由向量X、Y和Z指定的位置显示大小和颜色分别由S和C决定的离散点

figure;

[x,y,z] = sphere(16);

X = [x(:)*.5 x(:)*.75 x(:)];

Y = [y(:)*.5 y(:)*.75 y(:)];

Z = [z(:)*.5 z(:)*.75 z(:)];

S = repmat([10 2 5]*10,numel(x),1);

C = repmat([1 2 3],numel(x),1);

subplot(1,2,1);

scatter(X(:),Y(:),S(:),C(:));

title('scatter');

subplot(1,2,2);

scatter3(X(:),Y(:),Z(:),S(:),C(:),'filled'), view(-60,60);

title('scatter3');

%plotmatrix(X,Y)绘出X(p*M)与Y(p*N)的列组成的散度图(N,M)

figure;

X=randn(100,2);Y=randn(100,2);

subplot(1,3,1),plotmatrix(X);%等价于plotmatrix(X,X),除了对角上的图为X每一列的直方图hist(X(:,col))

title('plotmatrix(X)');

subplot(1,3,2),plotmatrix(X,X);

title('plotmatrix(X,X)');

subplot(1,3,3),plotmatrix(X,Y);

title('plotmatrix(X,Y)');

你可能感兴趣的:(数据分析,直方图)