机器学习-数据科学库(HM)_第3节_numpy
机器学习-数据科学库(HM)_第3节_numpy
- numpy
-
- 什么是numpy
- numpy基础
-
- numpy创建数组(矩阵)
- 数据类型的操作
- 数组的形状
- 数组和数的计算
- 广播原则
- 轴
-
- 二维数组的轴
- 三维数组的轴
- numpy常用方法
-
- numpy读取数据
-
- numpy读取和储存数据的实现
- numpy中的转置(transpose)
- numpy索引和切片
-
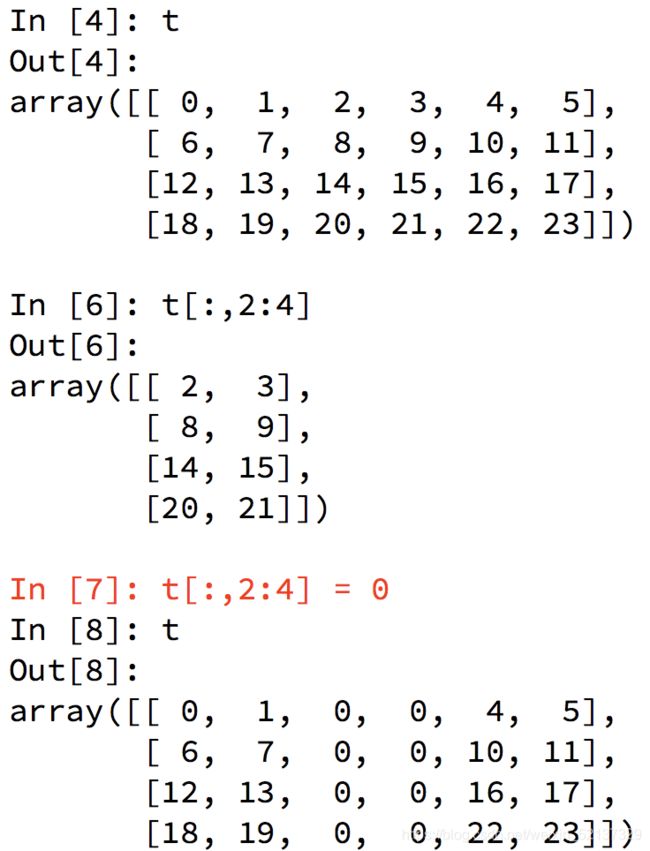
- numpy中数值的修改
- numpy中的布尔索引
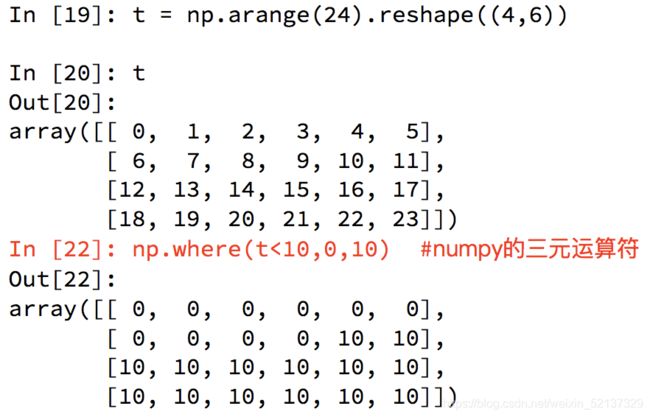
- numpy中三元运算符
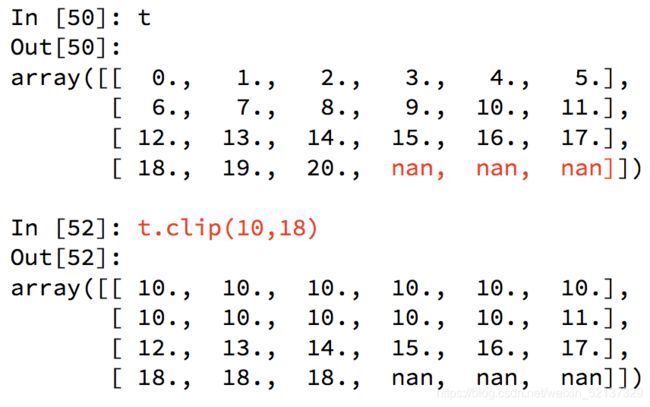
- numpy中的clip(裁剪)
- numpy中的nan和inf
-
- numpy中的nan的注意点
- ndarry缺失值填充均值
- 数组的拼接
-
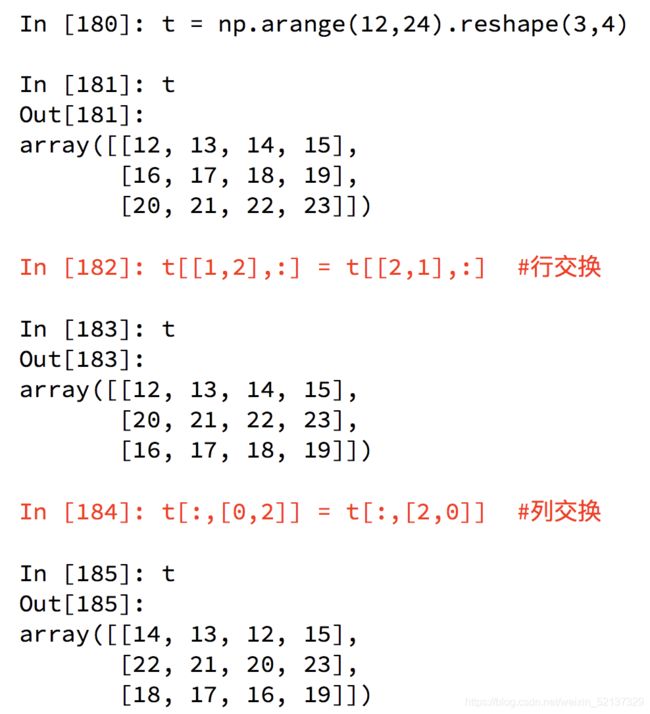
- 数组的行列交换
- 数组的拼接和行列交换的实现
- numpy更多好用的方法
- numpy生成随机数
- numpy常用统计方法
- 应用:youtube直方图
- 应用:youtube散点图
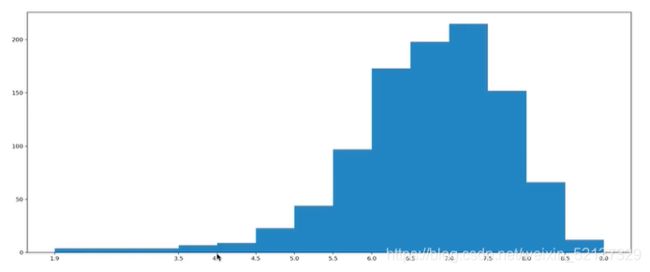
- 应用:豆瓣不等宽组距的直方图
- numpy的注意点copy和view
- 总结
numpy
什么是numpy
-为什么要学习numpy?
- 快速
- 方便
- 科学计算的基础库
- 什么是numpy?
- 一个在Python中做科学计算的基础库,重在数值计算,也是大部分PYTHON科学计算库的基础库,多用于在大型、多维数组上执行数值运算。
- 数组:矩阵、array、list
- 一个在Python中做科学计算的基础库,重在数值计算,也是大部分PYTHON科学计算库的基础库,多用于在大型、多维数组上执行数值运算。
numpy基础
numpy创建数组(矩阵)
- 创建数组:
import numpy as np
t1 = np.array([1,2,3,])
t2 = np.array(range(10))
t3 = np.arange(4,10,2) - 数组的类名:
type(a)
> numpy.ndarray
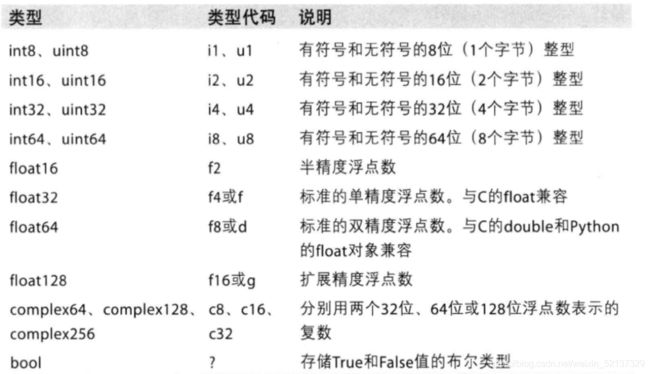
数据类型的操作
-
数据的类型:
a.dtype
> dtype(“int64”) -
制定创建的数组的数据类型:
t5 = np.array([1,1,0,1,0,0], dtype=bool)
t5 = np.array([1,1,0,1,0,0], dtype="?") -
修改数组的数据类型:
t6 = t5.astype(“int8”)
-
修改浮点型的小数位数:
- t8 = np.round(t7,2) # 保留2小数点后两位
- round(random.random(), 3)
- “%.2f”%random.random() # 随机生成一个小数点后保留2为的float
数组的形状
a = np.array([[3,4,5,6,7,8], [4,5,6,7,8,9]])
-
查看数组的形状:
a.shape >(2, 6) # 最里面的列表有6个元素,外层列表有2个元素;2行6列 t3 = np.array([[[1,2,3], [4,5,6]] [[7,8,9], [10,11,12]]]) t3.shape >(2,2,3) # 2块,每块2行3列 -
修改数组的形状,
不会对原来数组进行修改b = a.reshape((3,4)) >array([[3,4,5,6], [7,8,4,5] [6,7,8,9]]) # 把数组转化为一维度数据:方法一 b.reshape((12,)) array([3,4,5,6,7,8,4,5,6,7,8,9]) # 把数组转化为一维度数据:方法二,数组的维度未知 b.flattern() array([3,4,5,6,7,8,4,5,6,7,8,9]) # 把数组转化为一维度数据:方法三,数组的维度未知 b.reshape((b.shape[0]*b.shape[1],)) # 两种转化为一维度的错误辨析 b.reshape((1,12)) array([[3,4,5,6,7,8,4,5,6,7,8,9]]) b.reshape((12,1)) array([[3], [4], [5], .... [8], [9]]) b.reshape((1,24))
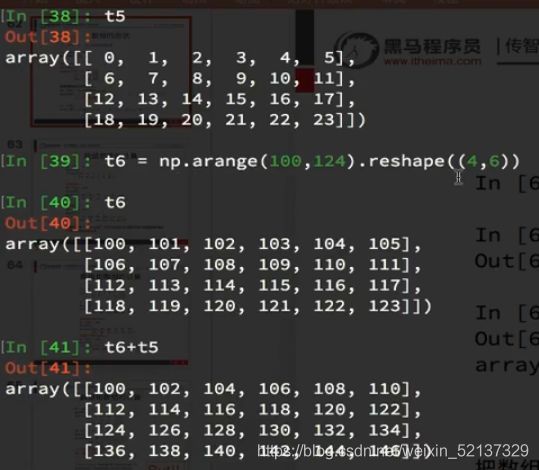
数组和数的计算
- a+1
- a*3
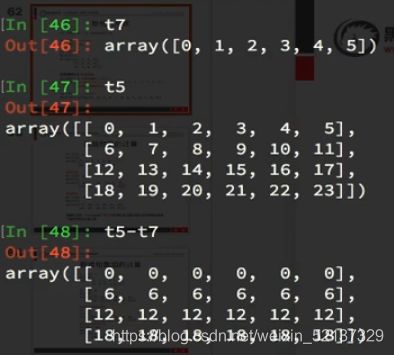
- numpy中的广播机制使在运算过程中,加减乘除的运算被广播到所有的元素上面。
- a+b / a*b :
广播原则
- 如果两个数组的后缘维度(trailing dimension,即从末尾开始算起的维度)的轴长度享福或其中一方的长度为1,则认为他们是广播兼容的。广播会在缺失和(或)长度为1的维度上进行。
- 可以把维度理解为shape所对应的数字个数
- shape为(3,3,3)的数组
不能和(3,2)的数组进行计算 - shape为(3,3,2)的数组
能够和(3,2)的数组进行计算 - shape为(3,3,2)的数组
能够和(3,3)的数组进行计算
- shape为(3,3,3)的数组
轴
- 在numpy中可以理解为方向,使用0, 1, 2…数字表示,对于一个一维数组,只有一个0轴,对于2维数组(shape(2, 2)),有0(行)轴和1(列)轴,对于三维数组(shape(2, 2, 3)),有0(块), 1(行), 2(列)轴。
- 有了轴的概念之后,我们计算会更加方便,比如计算一个2维数组的平均值,必须指定是计算哪个方向上面的数字的平均值。
二维数组的轴
三维数组的轴
numpy常用方法
numpy读取数据
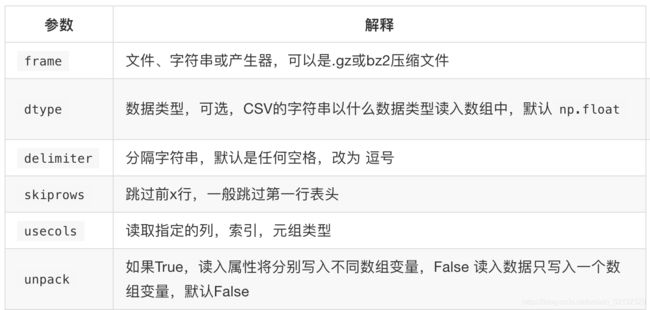
- numpy是从CSV(Comma-Separated Value)逗号分隔值文件中读取数据的,一般不用,常用pandas。
- np.loadtxt(fname,dtype=np.float,delimiter=None,skiprows=0,usecols=None,unpack=False)
numpy读取和储存数据的实现
- 数据来源:https://www.kaggle.com/datasnaek/youtube/data
- 现在这里有一个英国和美国各自youtube1000多个视频的点击、喜欢、不喜欢、评论数量([“views”,“likes”,“dislikes”,“comment_total”])的csv,运用刚刚所学习的只是,我们尝试来对其进行操作。
# coding:utf-8
import numpy as np

us_file_path = "./youtube_video_data/US_video_data_numbers.csv"
t = np.loadtxt(us_file_path, delimiter=",", dype="int", unpack=True)
numpy中的转置(transpose)
numpy索引和切片
- 取行(np.array):t[2]
- 取连续的多行:t[2:]
- 取不连续的多行:t[[2, 8, 18]]
- 取行\列: t[行, 列]
- 取第二行:t[1, :]
- 取列:t[:, 0]
- 取连续的多列:t[:, 2:]
- 取不连续的多列:t[:, [0, 2]]
- 取第3行、第4列的值(np.int64):t[3, 4]
- 取多行和多列:取交叉点的array
- 取第3行到第5行,第2列到第4列:t[2:5, 1:4]
- 取多个不相邻的点:t[[0, 2], [0, 1]]
numpy中数值的修改
numpy中的布尔索引
numpy中三元运算符
numpy中的clip(裁剪)
numpy中的nan和inf
- Nan(Nan,Nan):表示不是一个数字
- np.nan,type=float
- 什么时候出现nan:
- 当我们读取本地的文件为float的时候,如果有缺失,就会出现nan。
- 当做了一个不合适的计算的时候,比如无穷大(inf)减去无穷大。
- inf(-inf,inf):inf表示正无穷,-inf表示负无穷
- np.inf,type=float
- 什么时候出现inf:
- 比如一个数字除以0,python中直接会报错,numpy中是一个inf或者-inf。
numpy中的nan的注意点
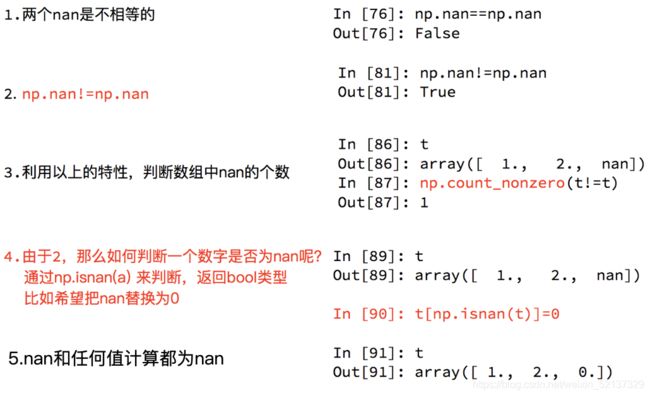
- 统计nan的个数
- np.count_nonzero(t2!=t2)
- np.count_nonzero(np.isnan(t2))
- nan和任何值计算都为nan
- 若t2中有nan,则np.sum(t2)返回nan
- 因此在进行计算的时候,希望吧nan进行赋值来计算,但不能把他们全部替换为0
- 全部替换为0后,替换之前的平均值如果大于0,替换之后的均值肯定会变小,所以一般
- 把缺失的数值替换为均值(中值)
- 直接删除有缺失值的一行。
- 全部替换为0后,替换之前的平均值如果大于0,替换之后的均值肯定会变小,所以一般
ndarry缺失值填充均值
# coding=utf-8
import numpy as np

def fill_ndarray(t1):
	# 遍历每一列
	for i in range(t1.shape[1]):
		temp_col = t1[:, i]	# 当前的一列
		nan_num = np.count_nonzero(temp_col!=temp_col)	#  找出值为nan的元素的个数
		if nan_num != 0:	# 不为0,说明当前这一列中有nan
			temp_not_nan_col = temp_col[temp_col==temp_col]	# 当前一列不为nan的array
			temp_not_nan_col.mean()
			# 选中当前为nan的位置,赋值为不为nan的,本列的均值
			temp_col[np.isnan(temp_col)] = temp_not_nan_col.mean()
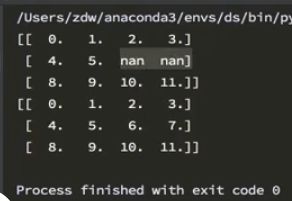
	return t1

if __name__ == "__main__":
	t1 = np.arrange(12).reshape((3,4)).astype("float")
	t1[1, 2:] = np.nan	# 设置2行3、4列的值为nan
	t1 = fill_ndarray(t1)
数组的拼接
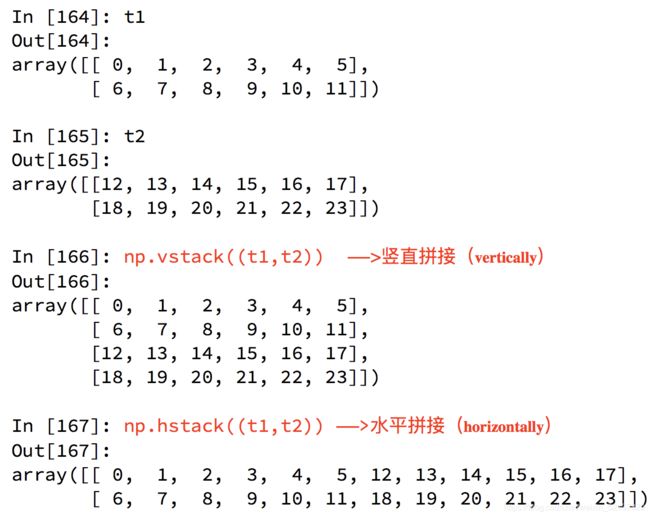
竖直分割与竖直拼接互为inverse。- 竖直拼接(vertically):np.vstack((t1, t2))
- 注意:需要确定每一列代表的意义相同!!!否则牛头不对马嘴。
- 水平拼接(horizontally):np.hstack((t1, t2))
数组的行列交换
数组的拼接和行列交换的实现
- 现在希望把之前案例中两个国家的数据方法一起来研究分析,同时保留国家的信息(每条数据的国家来源),应该怎么办?
# coding=utf-8
import numpy as np

us_data = "./youtube_video_data/US_video_data_numbers.csv"
uk_data = "./youtube_video_data/GB_video_data_numbers.csv"

# 加载国家数据
us_data = np.loadtxt(us_data, delimiter=",", dtype="int")
uk_data = np.loadtxt(uk_data, delimiter=",", dtype="int")

# 添加国家信息
# 构造全为0的列:us_data.shape[0]获得列表行数
zeros_data = np.zeros((us_data.shape[0], 1)).astype(int)
# 构造全为1的列
ones_data = np.ones((uk_data.shape[0], 1)).astype(int)

# 分别添加一列全为0的数据和全为1的数据
us.data = np.hstack((us_data, zeros_data))
uk.data = np.hstack((uk_data, ones_data))

# 拼接两组数据
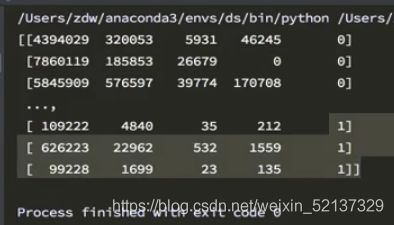
final_data = np.vstack((us_data, uk_data))
numpy更多好用的方法
- 获取最大值最小值的位置
- 每一列的最大值:np.argmax(t, axis=0),
和行的形状是一样的 - 每一行的最大值:np.argmin(t, axis=1),
和列的形状是一样的
- 每一列的最大值:np.argmax(t, axis=0),
- 创建一个全0的数组:np.zeros((3,4))
- 创建一个全1的数组:np.ones((3,4))
- 创建一个 3 ∗ 3 3*3 3∗3的identity matrix:np.eye(3)
numpy生成随机数
- np.random.----
numpy常用统计方法
- 默认返回多维数组的全部的统计结果,如果指定axis则返回一个当前轴上的结果
- 在每一列上操作:axis=0,
和行的形状是一样的 - 在每一行上操作:axis=1,
和列的形状是一样的
- 在每一列上操作:axis=0,
- 求和:t.sum(axis=None)
- 均值:t.mean(a,axis=None) 受离群点的影响较大
- 中值:np.median(t,axis=None)
- 最大值:t.max(axis=None)
- 最小值:t.min(axis=None)
- 极值:np.ptp(t,axis=None) 即最大值和最小值只差
- 标准差:t.std(axis=None) 越大波动越大
应用:youtube直方图
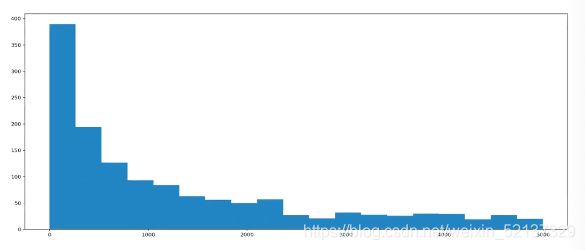
- 英国和美国各自youtube1000的数据结合之前的matplotlib绘制出各自的评论数量的直方图。
# coding=utf-8
import numpy as np
from matplotlib import pyplot as plt

us_file_path = "./youtube_video_data/US_video_data_numbers.csv"
t_us = np.loadtxt(us_file_path, delimiter=",", dtype="int")

# 取评论的数据
t_us_comments = t_us[:,-1]

# 选择比5000小的数据
t_us_comments = t_us_comments[t_us_comments<=5000]

d = 250
bin_mums = (t_us_comments.max() - t_us_comments.max()) // d	# max = 500000, min = 0, 极差过大,但大多数值差异没有那么大,所以需要去掉过大的值。如果bin_nums除不尽的话,图像会发生偏移

# 绘图
plt.figure(figuresize=(20, 8), dpi=80)

plt.hist(t_us_comments)

plt.show()
应用:youtube散点图
- 希望了解美国的youtube中视频的评论数和喜欢数的关系,应该如何绘制改图:散点图。
us_file_path = "./youtube_video_data/US_video_data_numbers.csv"

t_us = np.loadtxt(us_file_path, delimiter=",", dtype="int")
# 选择比500000小的数据(以此来凸出过小的变化们)
t_us = t_us[t_us[:,1]<=500000]

t_us_comment = t_us[:, -1]
t_us_like = t_us[:, 1]

plt.figure(figuresize=(20, 8), dpi=80)
plt.scatter(t_us_like, t_us_comment)

plt.show()
应用:豆瓣不等宽组距的直方图
import numpy as np
from matplotlib import pyplot

runtime_data = np.array([.........])
max_runtime = runtime_data.max()
min_runtime = runtime_data.min()
print(max_runtime - min_runtime)

# 设置不等宽的组距,hist方法中渠道的会是一个左闭右开的区间[1.9, 3.5)
num_bin_list = [1.9, 3.5]
i = 3.5
while i < max_runtime:
	i += 0.5
	num_bin_list.append(i)

# 设置图形的大小
plt.figure(figuresize(20, 8), dpi=80)
plt.hist(runtime_data, num_bin_list)

# xticks让之前的组距能够对的上
plt.xticks(num_bin_list)

plt.show()
numpy的注意点copy和view
- a=b 完全不复制,a和b相互影响 。
- a = b[:] 视图的操作,一种切片,会创建新的对象a,但是a的数据完全由b保管,他们两个的数据变化是一致的。
- a = b.copy() 复制,a和b互不影响。
