Seurat | 强烈建议收藏的单细胞分析标准流程(细胞周期的影响去除)(三)
1写在前面
在scRNAseq数据中,不同细胞处在不同细胞周期,如果不进行异质性校正的话,会对结果有很大的影响。
常用的方法是根据经典的细胞周期基因进行评分,即cell cycle scores, 然后在预处理时将score纳入回归中。
2用到的包
rm(list = ls())
library(Seurat)
library(tidyverse)
library(ggsci)
3示例数据
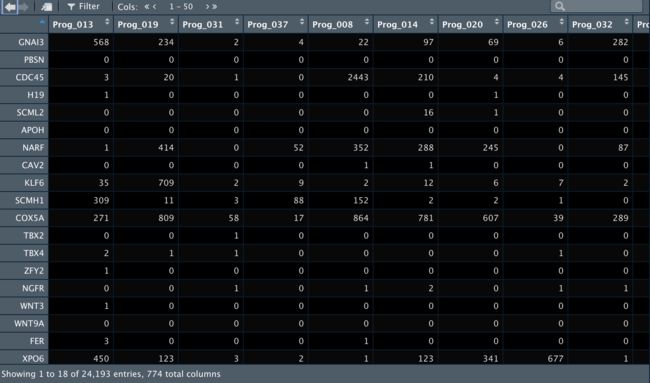
exp.mat <- read.table(file = "./nestorawa_forcellcycle_expressionMatrix.txt",
                      header = TRUE, as.is = TRUE, row.names = 1)
4Seurat标准流程处理
4.1 创建Seurat对象
marrow <- CreateSeuratObject(counts = exp.mat)
marrow

4.2 归一化(Normalization)
marrow <- NormalizeData(marrow)

4.3 寻找高变基因
marrow <- FindVariableFeatures(marrow, selection.method = "vst")

4.4 标准化
marrow <- ScaleData(marrow, features = rownames(marrow))

5查看并提取细胞周期基因
Seurat包内置了细胞周期的相关基因集,我们来看一下不同周期里的基因吧。
这里提供的是人的细胞周期的相关基因,如果你做的是小鼠,你需要做一下转换,解决方案如下:
https://www.r-bloggers.com/2016/10/converting-mouse-to-human-gene-names-with-biomart-package/ (如果大家需要讲解的人多,以后可以专门写一期这个方面的东西,欢迎留言。)
5.1 查看细胞周期基因集
Note! 这里演示我们用的是老版本,这里补充一下新版本,cc.genes.updated.2019。
cc.genes

5.2 提取细胞周期基因
这里我们将不同周期的基因提取出来,即S期,G2期和M期。
s.genes <- cc.genes$s.genes
g2m.genes <- cc.genes$g2m.genes
6主成分分析
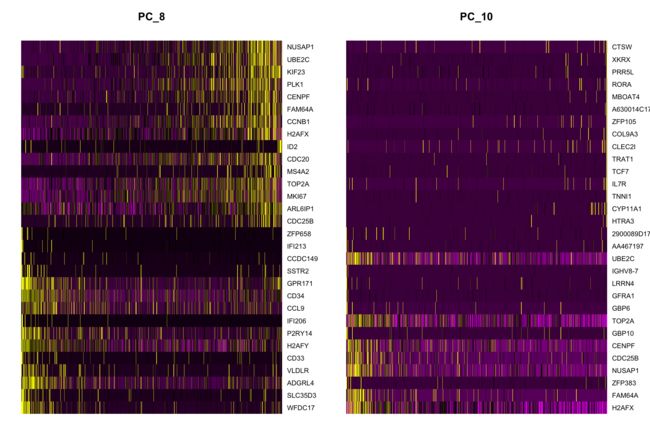
这里我们可以看到一些细胞周期基因在PC8和PC10是有显著差别的, 如TOP2A和MKI67等。
marrow <- RunPCA(marrow, features = VariableFeatures(marrow),
                 ndims.print = 1:10, nfeatures.print = 10)

DimHeatmap(marrow, dims = c(8, 10),
           fast = T)
7计算细胞周期评分
7.1 计算评分
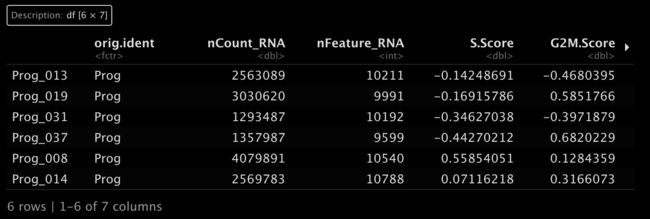
现在我们可以根据这些细胞周期基因开始计算评分了。
marrow <- CellCycleScoring(marrow,
                           s.features = s.genes,
                           g2m.features = g2m.genes,
                           set.ident = TRUE)

head(marrow[[]])
7.2 可视化-ridgeplot
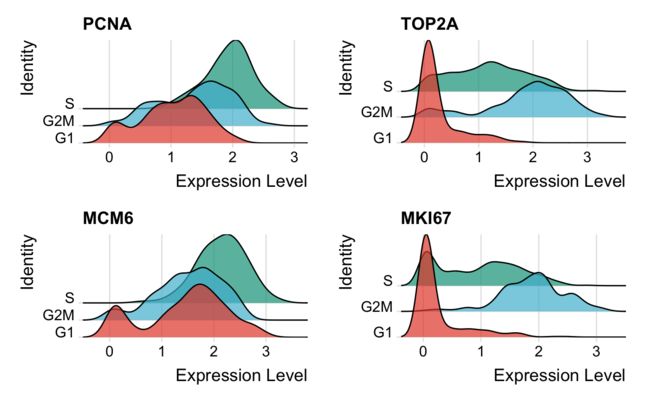
看一下几个细胞周期基因的分布情况。
RidgePlot(marrow,
          features = c("PCNA", "TOP2A", "MCM6", "MKI67"),
          cols = pal_npg("nrc", alpha = 0.7)(3),
          ncol = 2)
7.3 可视化-PCA
我们用细胞周期基因做一下PCA,有明显的分别。
marrow <- RunPCA(marrow, features = c(s.genes, g2m.genes))
DimPlot(marrow,
        cols = pal_npg("nrc", alpha = 0.7)(3))

8排除细胞周期异质性的影响
计算好细胞周期的评分以后,我们就可以在标准化的时候加入这个变量了,去除它的影响。
8.1 开始去除
marrow <- ScaleData(marrow,
                    vars.to.regress = c("S.Score", "G2M.Score"),
                    features = rownames(marrow))

8.2 可视化-PCA
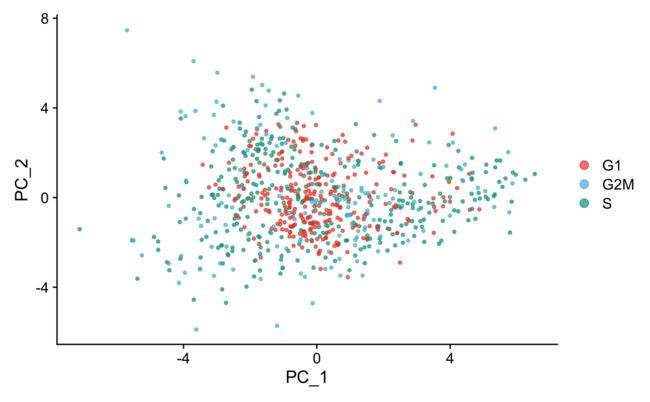
这个时候我们再用细胞周期基因做一下PCA看看结果,成功聚在一起,没有明显的区分啦。
marrow <- RunPCA(marrow, features = VariableFeatures(marrow), nfeatures.print = 10)
marrow <- RunPCA(marrow, features = c(s.genes, g2m.genes))
DimPlot(marrow,
        cols = pal_npg("nrc", alpha = 0.7)(3))
9可选步骤
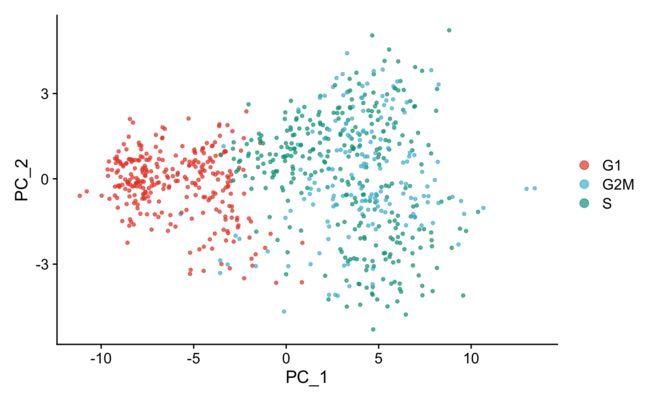
以上讲述的方法删除了所有与细胞周期相关的信号值。
在某些情况下,如分化过程中(如小鼠造血),干细胞处于静止状态,而分化细胞正处于增殖状态(反之亦然)。
在这种情况下,回归所有细胞周期效应,会影响干细胞和祖细胞的区分。
所以,在这里我们采用G2M期和S期得分之间的差值进行回归。
marrow$CC.Difference <- marrow$S.Score - marrow$G2M.Score
marrow <- ScaleData(marrow, vars.to.regress = "CC.Difference", features = rownames(marrow))

可视化一下吧!~
这里虽然细胞群聚在一起,但G1期和G2M期/S期是可以区分开的。
marrow <- RunPCA(marrow, features = VariableFeatures(marrow), nfeatures.print = 10)
marrow <- RunPCA(marrow, features = c(s.genes, g2m.genes))
DimPlot(marrow,
        cols = pal_npg("nrc", alpha = 0.7)(3))

需要示例数据的小伙伴,在公众号回复
Cellcycle获取吧!点个在看吧各位~ ✐.ɴɪᴄᴇ ᴅᴀʏ 〰
本文由 mdnice 多平台发布