Matplotlib调用imshow()函数绘制热图
Matplotlib进行绘图操作
调用函数绘图,重点知识:
- plot(x, y, marker=‘D’)表示绘制折线图,marker设置样式菱形。
- scatter(x, y, marker=‘s’, color=‘r’)绘制散点图,红色正方形。
- bar(x, y, 0.5, color=‘c’)绘制柱状图,间距为0.5,原色。
- hist(data,40,normed=1,histtype=‘bar’, facecolor=‘yellowgreen’,alpha=0.75)直方图。
- 设置x轴和y轴的坐标值:xlim(-2.5, 2.5) #设置x轴范围 ylim(-1, 1) #设置y轴范围
- 显示中文和负号代码如下:
plt.rcParams[‘font.sas-serig’]=[‘SimHei’] #用来正常显示中文标签
plt.rcParams[‘axes.unicode_minus’]=False #用来正常显示负号
完整代码为:
# coding=utf-8
import numpy as np
from pylab import *
from matplotlib import pyplot as plt

x = [1, 2, 3, 4]
y = [3, 5, 10, 25]

#创建Figure
fig = plt.figure()

#创建一个或多个子图(subplot绘图区才能绘图)
ax1 = fig.add_subplot(231)
plt.plot(x, y, marker='D') #绘图及选择子图
plt.sca(ax1)

ax2 = fig.add_subplot(232)
plt.scatter(x, y, marker='s', color='r')
plt.sca(ax2)
plt.grid(True)

ax3 = fig.add_subplot(233)
plt.bar(x, y, 0.5, color='c') #柱状图 width=0.5间距
plt.sca(ax3)

ax4 = fig.add_subplot(234)
#高斯分布
mean = 0  #均值为0
sigma = 1 #标准差为1 (反应数据集中还是分散的值)
data = mean+sigma*np.random.randn(10000)
plt.hist(data,40,normed=1,histtype='bar',facecolor='yellowgreen',alpha=0.75)
plt.sca(ax4)

m = np.arange(-5.0, 5.0, 0.02)
n = np.sin(m)
ax5 = fig.add_subplot(235)
plt.plot(m, n)
plt.sca(ax5)

ax6 = fig.add_subplot(236)
xlim(-2.5, 2.5) #设置x轴范围
ylim(-1, 1)     #设置y轴范围
plt.plot(m, n)
plt.sca(ax6)
plt.grid(True)

plt.show()
imshow详解热图知识
热图(heatmap)是数据分析的常用方法,通过色差、亮度来展示数据的差异、易于理解。Python在Matplotlib库中,调用imshow()函数实现热图绘制。
imshow(X, cmap=None, norm=None, aspect=None, interpolation=None, alpha=None, \
       vmin=None, vmax=None, origin=None, extent=None, shape=None, filternorm=1,\
       filterrad=4.0, imlim=None, resample=None, url=None, hold=None, data=None, **kwargs)
其中,X变量存储图像,可以是浮点型数组、unit8数组以及PIL图像,如果其为数组,则需满足一下形状:
- M*N 此时数组必须为浮点型,其中值为该坐标的灰度;
- MN3 RGB(浮点型或者unit8类型)
- MN4 RGBA(浮点型或者unit8类型)
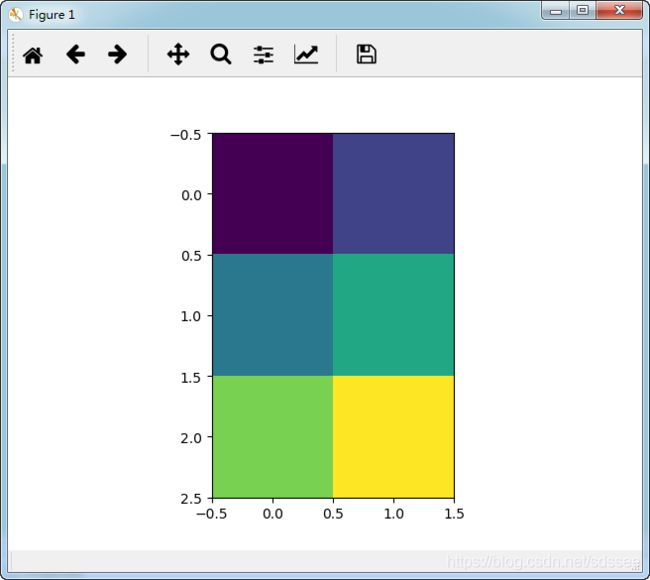
下面这段代码是一个简单的实例:
# coding=utf-8
from matplotlib import pyplot as plt

X = [[1,2],[3,4],[5,6]]
plt.imshow(X)
plt.show()
输出如下图所示:
Colorbar:增加颜色类标的代码是plt.colorbar(),代码如下:
#coding=utf-8
from matplotlib import pyplot as plt

X = [[1,2],[3,4],[5,6]]
plt.imshow(X)
plt.colorbar()
plt.show()
运行结果如下图所示,其中左上角颜色为蓝色,对应值为1;右下角颜色为深红色,对应值为6。它是按照矩阵X进行颜色分布的。
[1, 2] [深蓝, 浅蓝]
[3, 4] [淡绿, 黄色]
[5, 6] [橙红, 深红]
plt.colorbar(cax=None,ax=None,shrink=0.5)可设置Bar为一半长度。

Colormap:参数cmap用于设置热图的Colormap。
Colormap是MATLAB里面用来设定和获取当前色图的函数,可以设置如下色图:
- hot:从黑平滑过度到红、橙色和黄色的背景色,然后到白色。
- cool:包含青绿色和品红色的阴影色。从青绿色平滑变化到品红色。
- gray:返回线性灰度色图。
- bone:具有较高的蓝色成分的灰度色图。该色图用于对灰度图添加电子的视图。
- white:全白的单色色图。
- spring:包含品红和黄的阴影颜色。
- summer:包含绿和黄的阴影颜色。
- autumn:从红色平滑变化到橙色,然后到黄色。
- winter:包含蓝和绿的阴影色。
下面这段代码是显示原图、灰度(gray)、和春夏秋冬的示例。
#coding=utf-8
from matplotlib import pyplot as plt

X = [[1,2],[3,4]]

fig = plt.figure()
ax = fig.add_subplot(231)
ax.imshow(X)

ax = fig.add_subplot(232)
ax.imshow(X, cmap=plt.cm.gray) #灰度

ax = fig.add_subplot(233)
im = ax.imshow(X, cmap=plt.cm.spring) #春
plt.colorbar(im)

ax = fig.add_subplot(234)
im = ax.imshow(X, cmap=plt.cm.summer)
plt.colorbar(im, cax=None, ax=None, shrink=0.5) #长度为半

ax = fig.add_subplot(235)
im = ax.imshow(X, cmap=plt.cm.autumn)
plt.colorbar(im, shrink=0.5, ticks=[-1,0,1])

ax = fig.add_subplot(236)
im = ax.imshow(X, cmap=plt.cm.winter)
plt.colorbar(im, shrink=0.5)

plt.show()
运行结果如下图所示:

通常图片都是由RGB组成,一块一块的,详见我的数字图像处理系列博客,这里想把某块显示成一种颜色,则需要调用interpolation='nearest’参数即可,代码如下:
#coding=utf-8
from matplotlib import pyplot as plt

X = [[0, 0.25], [0.5, 0.75]]


fig = plt.figure()
ax = fig.add_subplot(121)
im = ax.imshow(X, cmap=plt.get_cmap('hot'))
plt.colorbar(im, shrink=0.5)

ax = fig.add_subplot(122)
im = ax.imshow(X, cmap=plt.get_cmap('hot'), interpolation='nearest',
               vmin=0, vmax=1)
plt.colorbar(im, shrink=0.2)
plt.show()
运行结果如下图所示:

推荐文章:matplotlib imshow - default colour normalisation
默认情况下,imshow将数据标准化为最小和最大值。 您可以使用vmin和vmax参数或norm参数来控制(如果您想要非线性缩放)。
百度经验提供一段代码,也不错,推荐大家学习。
注意:相当于在AJ和aj的图像矩阵中,产生10*10的随机数,对矩阵进行颜色填充;只是在填充过程中,选择随机数的最大值和最小值进行标准化处理。
# coding=utf-8
import numpy as np
from matplotlib import pyplot as plt
from matplotlib import cm
from matplotlib import axes

def draw_heatmap(data,xlabels,ylabels):
    #cmap=cm.Blues
    cmap=cm.get_cmap('rainbow',1000)
    figure=plt.figure(facecolor='w')
    ax=figure.add_subplot(1,1,1,position=[0.1,0.15,0.8,0.8])
    ax.set_yticks(range(len(ylabels)))
    ax.set_yticklabels(ylabels)
    ax.set_xticks(range(len(xlabels)))
    ax.set_xticklabels(xlabels)
    vmax=data[0][0]
    vmin=data[0][0]
    for i in data:
        for j in i:
            if j>vmax:
                vmax=j
            if j<vmin:
                vmin=j
    map=ax.imshow(data,interpolation='nearest',cmap=cmap,aspect='auto',vmin=vmin,vmax=vmax)
    cb=plt.colorbar(mappable=map,cax=None,ax=None,shrink=0.5)
    plt.show()

a=np.random.rand(10,10)
print a
xlabels=['A','B','C','D','E','F','G','H','I','J']
ylabels=['a','b','c','d','e','f','g','h','i','j']
draw_heatmap(a,xlabels,ylabels)


