聚类分析 | MATLAB实现k-Means(k均值聚类)分析
目录
-
-
- 聚类分析 | MATLAB实现k-Means(k均值聚类)分析
- k-均值聚类简介
- 相关描述
- 程序设计
- 学习小结
- 参考资料
- 致谢
-
聚类分析 | MATLAB实现k-Means(k均值聚类)分析
k-均值聚类简介
k均值聚类是一种分区方法。该函数kmeans将数据划分为k 个互斥的簇,并返回它为每个观察分配的簇的索引。 kmeans将数据中的每个观察值视为在空间中具有位置的对象。该函数找到一个分区,其中每个集群中的对象尽可能彼此靠近,并尽可能远离其他集群中的对象。您可以根据数据的属性选择要使用 的距离度量kmeans。像许多聚类方法一样,k-means 聚类要求您在聚类之前指定聚类数k。
与层次聚类不同,k均值聚类对实际观察进行操作,而不是对数据中每对观察之间的差异进行操作。此外,k- means 聚类创建单个级别的集群,而不是多级的集群层次结构。因此,对于大量数据, k- means 聚类通常比层次聚类更合适。
k- means 分区中的每个集群由成员对象和质心(或中心)组成。在每个集群中,kmeans最小化质心与集群所有成员对象之间的距离总和。 kmeans对于支持的距离度量,以不同的方式计算质心簇。
- 可以使用可用于的名称-值对参数来控制最小化的细节 kmeans;例如,可以指定聚类质心的初始值和算法的最大迭代次数。默认情况下,kmeans使用k -means++ 算法初始化聚类质心,并使用平方欧几里德距离度量来确定距离。
- 执行k均值聚类时,一般步骤:
- 比较ķ -means集群解决方案的不同值ķ确定集群,为数据的最佳数量。
- 通过检查轮廓图和轮廓值来评估聚类解决方案。还可以使用该evalclusters函数,根据间隙值、轮廓值、Davies-Bouldin 指数值和 Calinski-Harabasz 指数值等标准评估聚类解决方案。
- 从不同的随机选择的质心复制聚类,并返回所有复制中距离总和最小的解决方案。
相关描述
20 世纪 20 年代,植物学家收集了 150 个鸢尾花标本(三个品种各取 50 个标本)的萼片长度、萼片宽度、花瓣长度和花瓣宽度的测量值。这些测量值被称为 Fisher 鸢尾花数据集。
在此数据集中,每个观测值都来自一个已知的品种,因此已经有明显的方法对数据进行分组。现在,我们将忽略品种信息,仅使用原始测量值对数据进行聚类。完成后,我们可以将得到的簇与实际的品种进行比较,以了解这三种鸢尾花是否具有不同的特性。
程序设计
使用 K 均值聚类方法对 Fisher 鸢尾花数据进行聚类
- 函数 kmeans 使用迭代算法执行 K 均值聚类,该算法将对象分配给簇,使每个对象到其所在簇质心的距离之和最小。对 Fisher 鸢尾花数据应用该函数时,它将根据鸢尾花标本萼片和花瓣的测量值找到它们的自然分组。使用 K 均值聚类,您必须指定要创建的簇数。
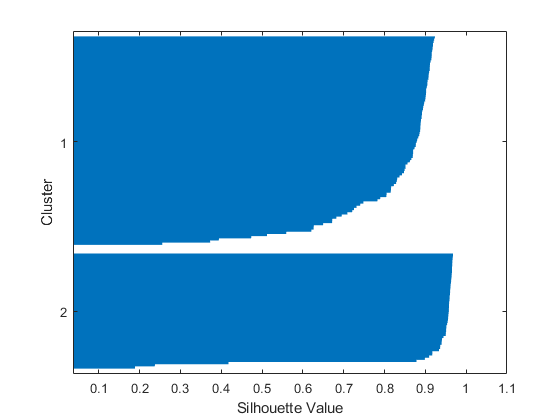
- 首先,加载数据并调用 kmeans,将所需的簇数设置为 2,并使用平方欧几里德距离。要了解生成的簇区分数据的效果,可以绘制轮廓图。轮廓图显示一个簇中的每个点与相邻簇中的点的接近程度。
load fisheriris
[cidx2,cmeans2] = kmeans(meas,2,'dist','sqeuclidean');
[silh2,h] = silhouette(meas,cidx2,'sqeuclidean');
- 从轮廓图中可以看出,两个簇中的大多数点都具有较大的轮廓值(大于 0.8),表明这些点可以与相邻簇很好地区分。但是,每个簇中还有一些点的轮廓值较低,表示它们靠近其他簇中的点。
- 事实证明,这些数据中的第四个测量值(花瓣宽度)与第三个测量值(花瓣长度)高度相关,因此前三个测量值的三维图可以很好地表示数据,而无需求助于四个维度。如果绘制数据,则使用不同的符号表示 kmeans 创建的每个簇,就可以识别轮廓值较小的点,也就是与其他簇中的点相距较近的点。
ptsymb = {'bs','r^','md','go','c+'};
for i = 1:2
    clust = find(cidx2==i);
    plot3(meas(clust,1),meas(clust,2),meas(clust,3),ptsymb{i});
    hold on
end
plot3(cmeans2(:,1),cmeans2(:,2),cmeans2(:,3),'ko');
plot3(cmeans2(:,1),cmeans2(:,2),cmeans2(:,3),'kx');
hold off
xlabel('Sepal Length');
ylabel('Sepal Width');
zlabel('Petal Length');
view(-137,10);
grid on
- 每个簇的质心用带圆圈的 X 表示。下方簇中用三角形表示的点中,有三个非常靠近上方簇中用正方形表示的点。由于上方簇相当分散,这三个点更靠近下方簇的质心而不是上方簇的质心,虽然这些点与所在簇中的大部分点存在明显距离。由于 K 均值聚类只考虑距离而不是密度,因此可能会出现这种结果。
- 可以增加簇数以查看 kmeans 是否可以在数据中找到进一步的分组结构。这次,使用可选的 ‘Display’ 名称-值对组参数显示聚类算法中有关每次迭代的信息。
[cidx3,cmeans3] = kmeans(meas,3,'Display','iter');
 iter	 phase	     num	         sum
     1	     1	     150	     146.424
     2	     1	       5	     144.333
     3	     1	       4	     143.924
     4	     1	       3	      143.61
     5	     1	       1	     143.542
     6	     1	       2	     143.414
     7	     1	       2	     143.023
     8	     1	       2	     142.823
     9	     1	       1	     142.786
    10	     1	       1	     142.754
Best total sum of distances = 142.754
- 在每次迭代时,kmeans 算法在簇之间重新分配点,以减小点到质心距离的总和,然后重新计算新簇分配的簇质心。距离总和与重新分配次数随着每次迭代而减小,直到算法达到最小值。kmeans 中使用的算法由两个阶段组成。在此示例中,算法的第二阶段未进行任何重新分配,表明第一阶段在进行几次迭代后就达到了最小值。
- 默认情况下,kmeans 使用随机选择的一组初始质心位置开始聚类过程。kmeans 算法会收敛于作为局部最小值的解;也就是说,kmeans 可对数据进行分区,使得将任一点移到其他簇都会增加距离总和。但是,同许多其他类型的数值最小化问题一样,kmeans 达到的解有时取决于起点。因此,该数据可能存在其他具有更小距离总和的解(局部最小值)。可以使用可选的 ‘Replicates’ 名称-值对组参数来检验不同的解。指定多次重复时,kmeans 会在每次重复时从不同的随机选择质心重新开始聚类过程。kmeans 随后返回所有重复中距离总和最小的解。
[cidx3,cmeans3,sumd3] = kmeans(meas,3,'replicates',5,'display','final');
Replicate 1, 9 iterations, total sum of distances = 78.8557.
Replicate 2, 10 iterations, total sum of distances = 78.8557.
Replicate 3, 8 iterations, total sum of distances = 78.8557.
Replicate 4, 8 iterations, total sum of distances = 78.8557.
Replicate 5, 1 iterations, total sum of distances = 78.8514.
Best total sum of distances = 78.8514
- 输出表明,即使对于这样相对简单的问题,也存在非全局最小值。这五次重复分别从一组不同的初始质心开始。根据起始位置,kmeans 达到两个不同的解之一。但是,kmeans 最终返回的解是所有重复中距离总和最小的解。第三个输出参数包含每个簇中对于该最佳解的距离总和。
sum(sumd3)
ans =

   78.8514
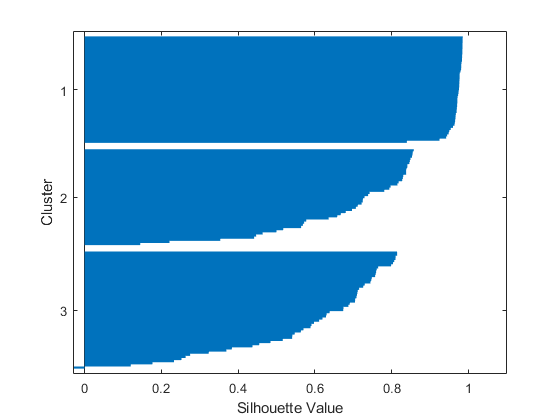
- 该三簇解的轮廓图显示,有一个簇区分效果很好,但另外两个簇的区别不是很明显。
[silh3,h] = silhouette(meas,cidx3,'sqeuclidean');
- 可以绘制原始数据以查看 kmeans 如何将点分配给簇。
for i = 1:3
    clust = find(cidx3==i);
    plot3(meas(clust,1),meas(clust,2),meas(clust,3),ptsymb{i});
    hold on
end
plot3(cmeans3(:,1),cmeans3(:,2),cmeans3(:,3),'ko');
plot3(cmeans3(:,1),cmeans3(:,2),cmeans3(:,3),'kx');
hold off
xlabel('Sepal Length');
ylabel('Sepal Width');
zlabel('Petal Length');
view(-137,10);
grid on
- 可以看到,kmeans 已将双簇解中的上方簇一分为二,而且这两个簇非常接近。跟之前的双簇解相比,这个三簇解是否更为有用取决于您在聚类后要对数据进行的操作。silhouette 的第一个输出参数包含每个点的轮廓值,您可以使用这些值对两个解进行定量比较。双簇解的平均轮廓值更大,表明就簇的区分效果而言,这是更好的解。
[mean(silh2) mean(silh3)]
ans =

    0.8504    0.7357
- 还可以使用不同距离对这些数据进行聚类。余弦距离可能适用于这些数据,因为它会忽略测量值的绝对大小,只考虑相对大小。因此,对于两朵大小不同但花瓣和萼片的形状相似的花,使用平方欧几里德距离可能不接近,但使用余弦距离则会接近。
[cidxCos,cmeansCos] = kmeans(meas,3,'dist','cos');
[silhCos,h] = silhouette(meas,cidxCos,'cos');
[mean(silh2) mean(silh3) mean(silhCos)]
- 请注意,簇的顺序与之前的轮廓图不一样。这是因为 kmeans 会随机选择初始簇分配。
- 通过绘制原始数据,您可以看到使用两种不同距离创建的簇在形状上的差异。两个解较为相似,但使用余弦距离时,上方的两个簇向原点拉伸。
for i = 1:3
    clust = find(cidxCos==i);
    plot3(meas(clust,1),meas(clust,2),meas(clust,3),ptsymb{i});
    hold on
end
hold off
xlabel('Sepal Length');
ylabel('Sepal Width');
zlabel('Petal Length');
view(-137,10);
grid on
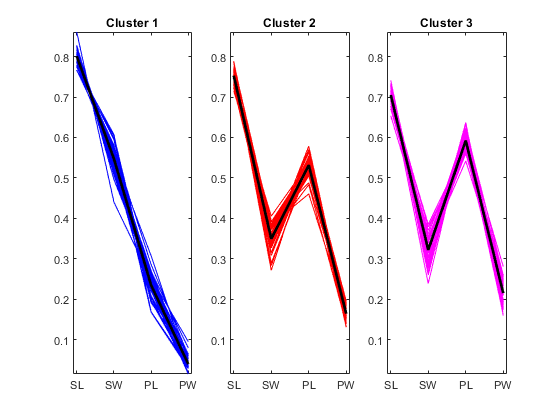
- 此图不包括簇质心,因为使用余弦距离时,质心是以原始数据空间原点为起点的射线。但是,您可以绘制归一化数据点的平行坐标图,以直观地了解簇质心的差异。
lnsymb = {'b-','r-','m-'};
names = {'SL','SW','PL','PW'};
meas0 = meas ./ repmat(sqrt(sum(meas.^2,2)),1,4);
ymin = min(min(meas0));
ymax = max(max(meas0));
for i = 1:3
    subplot(1,3,i);
    plot(meas0(cidxCos==i,:)',lnsymb{i});
    hold on;
    plot(cmeansCos(i,:)','k-','LineWidth',2);
    hold off;
    title(sprintf('Cluster %d',i));
    xlim([.9, 4.1]);
    ylim([ymin, ymax]);
    h_gca = gca;
    h_gca.XTick = 1:4;
    h_gca.XTickLabel = names;
end
- 从图中可以清楚地看出,三个簇所包含的标本在花瓣和萼片的平均相对大小方面明显不同。第一个簇的花瓣严格小于萼片。后面两个簇的花瓣和萼片的大小重叠,但第三个簇的重叠超过第二个簇。您还可以看到,第二个和第三个簇包含一些非常相似的标本。
- 因为我们知道数据中每个观测值所属的品种,所以可以将 kmeans 发现的簇与实际品种进行比较,以了解这三个品种是否具有明显不同的物理特性。实际上,如下图所示,使用余弦距离创建的簇与实际品种分组的不同之处只有五朵花。这五个点(用星形标记绘制)都靠近上方两个簇的边缘交界处。
subplot(1,1,1);
for i = 1:3
    clust = find(cidxCos==i);
    plot3(meas(clust,1),meas(clust,2),meas(clust,3),ptsymb{i});
    hold on
end
xlabel('Sepal Length');
ylabel('Sepal Width');
zlabel('Petal Length');
view(-137,10);
grid on
sidx = grp2idx(species);
miss = find(cidxCos ~= sidx);
plot3(meas(miss,1),meas(miss,2),meas(miss,3),'k*');
legend({'setosa','versicolor','virginica'});
hold off
学习小结
K 均值聚类是一种分区方法,它将数据中的观测值视为具有位置和相互间距离的对象。它将对象划分为 K 个互斥簇,使每个簇中的对象尽可能彼此靠近,并尽可能远离其他簇中的对象。每个簇的特性由其质心或中心点决定。当然,聚类中使用的距离通常不代表空间距离。
参考资料
[1] https://download.csdn.net/download/kjm13182345320/21487017
[2] https://blog.csdn.net/kjm13182345320/article/details/119839955?spm=1001.2014.3001.5501
[3] https://blog.csdn.net/kjm13182345320/article/details/119610707?spm=1001.2014.3001.5501
致谢
- 感谢大家订阅,感谢!
- 欢迎一起学习一起进步!


