机器学习 决策树DecisionTree 二分类原理与实战
序言
之前看过很多博客关于决策树的基本都是多分类的问题,二分类的问题会比较少 因此,在完成了对二分类数据集取得不错的预测结果后 在这里,博客记录一下,如果各位有什么问题,欢迎在评论区里留言,相互交流讨论
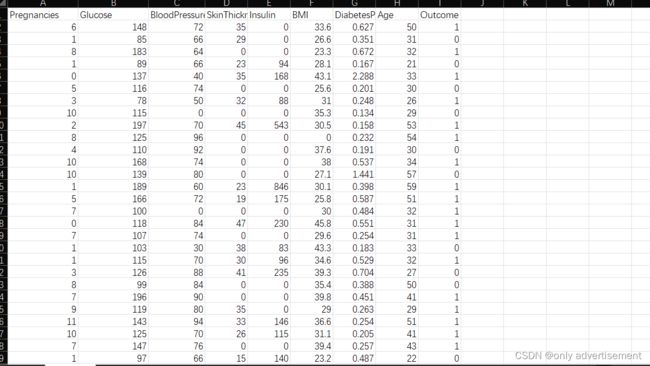
数据集:
通过收集体检者的数据,分析每个人的血糖值,年龄,bmi值,糖尿病家族史等特征,通过对这些的分析,判断是否为糖尿病患者,若是记为1,不是记为0,典型的二分类问题,有意下载数据评论区可留言
代码实战
导入相应需要使用的包,除了graphviz以外,其他应该都比较常用
graphviz决定了后面的画图,以及pdf文档的生成
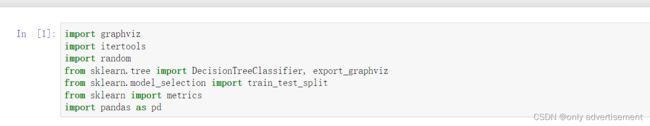
import graphviz
import itertools
import random
from sklearn.tree import DecisionTreeClassifier, export_graphviz
from sklearn.model_selection import train_test_split
from sklearn import metrics
import pandas as pd
// A code block
define the feature
col_names = [‘pregnant’, ‘glucose’, ‘bp’, ‘skin’, ‘insulin’, ‘bmi’, ‘pedigree’, ‘age’, ‘label’]
load dataset
df = pd.read_csv(“diabetes.csv”, header=0, names=col_names)
df.head()
完成后,开始进行划分测试与训练:
// A code block
# Split dataset into training set and test set
x_train, x_test, y_train, y_test = train_test_split(features,target,test_size=0.3, random_state=1)
# 70% training and 30% test
# Create Decision Tree classifer object
clf = DecisionTreeClassifier(criterion="entropy", max_depth=5)
# Train Decision
clf = clf.fit(x_train,y_train)
#Test,Predict the response for test dataset
y_pred = clf.predict(x_test)
y_pred
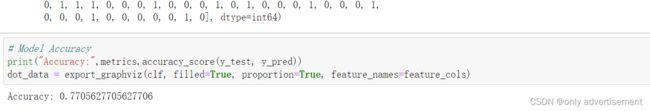
# Model Accuracy
print("Accuracy:",metrics.accuracy_score(y_test, y_pred))
dot_data = export_graphviz(clf, filled=True, proportion=True, feature_names=feature_cols)
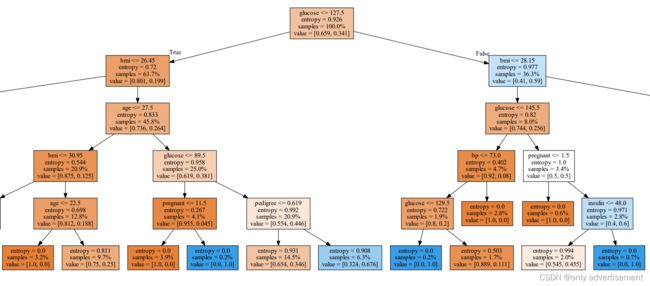
最后画图
#Use graphviz to draw the image
graph = graphviz.Source(dot_data)
graph.render(filename='decision_tree', cleanup=True, view=True)
正确率接近8成:
决策树成品展示: