tensorflow cifar10 分类预测实战,精准度0.794
第一步:读入数据
# 导入必要的库
import tensorflow as tf
from tensorflow import keras
from tensorflow.keras import datasets

import numpy as np
import matplotlib.pyplot as plt

# 获取数据集
(x, x_lable), (y, y_lable) = datasets.cifar10.load_data()
对数据进行归一化处理可以使得数据运算速度加快,同时减少异常数据带来的影响。本次数据集为图片,分布范围为0~255,仅需要将每一个数值除以255即可将数据集归纳到0~1之间。
x = x/255
y = y/255
第二步:设置回调函数
在模型训练过程中,我们无法对模型进行相关性的操作,此时就需要使用到tensflow中的回调函数了。
我们可以指定一个很大的epoch(训练轮数),当验证集的损失值在一定次数内都没有降低时,代表模型已经运行到了最优值附近,当前的学习率已经无法使得梯度继续下降了,此时就通过回调函数终止模型的训练。
# 提前结束训练
earlyStop = tf.keras.callbacks.EarlyStopping(monitor='val_loss', patience=25)
第一个参数代表监控模型训练过程中的参数
第二个参数代表能够容忍模型监控值没有下降的次数。
在模型的训练过程中,有时会出现一个良好的模型,此时我们可以通过回调函数保存这个模型。
# 设置模型保存节点
checkpoint_save_path = '.\\tmp\\model_4.h5'
cp_callback = tf.keras.callbacks.ModelCheckpoint(filepath=checkpoint_save_path,
                                                 monitor='val_loss', mode='min',
                                                 save_best_only=True)
第一个参数代表保存模型的路径
第二个参数代表监模型的值,
第三个参数代表保存值减小时更新模型
第四个参数表示仅保存最好的模型。
回调函数中还有很多有用的函数,比如控制学习率下降的函数,都在 tf.keras.callbacks中,有兴趣的可以自行了解。
同时,也可以自定义类,制作满足特定需求的回调函数。例如,提示当前训练伦次
class PrintEpochs(tf.keras.callbacks.Callback):
    def on_epoch_end(self, epoch, logs):
        print('当前轮次:', epoch)
第三步:构建模型
模型中有很多超参数,不同的参数都会对模型有一定影响,此处我训练过三种模型,最终选择最好的一种进行了模型的优化。
model_4 = tf.keras.Sequential([
    tf.keras.Input(shape=(x.shape[1:])),

    tf.keras.layers.BatchNormalization(),
    tf.keras.layers.Conv2D(filters=96, kernel_size=3, padding='same', activation='relu'),
    tf.keras.layers.MaxPooling2D(pool_size=2),
    tf.keras.layers.Dropout(0.2),

    tf.keras.layers.BatchNormalization(),
    tf.keras.layers.Conv2D(filters=64,kernel_size=3, padding='same', activation='relu'),
    tf.keras.layers.MaxPooling2D(pool_size=2),
    tf.keras.layers.Dropout(0.2),

    tf.keras.layers.BatchNormalization(),
    tf.keras.layers.Conv2D(filters=32, kernel_size=3, padding='same', activation='relu'),
    tf.keras.layers.Conv2D(filters=32, kernel_size=3, padding='same', activation='relu'),
    tf.keras.layers.Conv2D(filters=32, kernel_size=3, padding='same', activation='relu'),
    tf.keras.layers.Dropout(0.2),

    tf.keras.layers.Flatten(),
    tf.keras.layers.BatchNormalization(),
    tf.keras.layers.Dense(units=128, activation='relu'),
    tf.keras.layers.Dropout(0.2),
    tf.keras.layers.Dense(units=32, activation='relu'),
    tf.keras.layers.Dropout(0.1),
    tf.keras.layers.Dense(units=10, activation='softmax')
])
可以用过 model_4.summary() 查看模型结构。
本次模型共有37w的参数,模型相对较小。
第四步:训练模型
# 训练数据
history_4 = model_4.fit(x,x_lable,epochs=200,verbose=1,callbacks=[earlyStop,cp_callback],validation_split=0.2,batch_size=128)
第一个参数代表传入的训练集
第二个参数代表传入的训练集标签
第三个参数代表模型训练的轮次
第四个参数代表输出训练日志
第五个参数代表调用的回调函数
第六个参数代表训练集验证集的比例
第七个参数代表每批训练模型的大小
部分与运行结果:
查看训练好的两个模型:
# 最低损失值数据
new_model = tf.keras.models.load_model(checkpoint_save_path)
test_loss, test_acc = new_model.evaluate(y,  y_lable)
print('\nTest best accuracy:', test_acc)

# 最后一次运行数据
test_loss, test_acc = model_4.evaluate(y,  y_lable)
print('\nTest last accuracy:', test_acc)
运行结果:
此处我们选择model_4用于预测图片信息。
保存模型
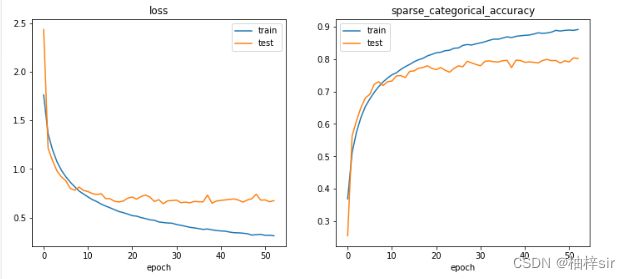
model_4.save('.\\tmp\\model_4_794.h5')查看模型训练过程中的代价函数(损失值)与准确度的变化过程
## 训练过程中的可视化
loss_train_val = history_4.history['loss']
loss_test_val = history_4.history['val_loss']

sparse_categorical_accuracy = history_4.history['sparse_categorical_accuracy']
val_sparse_categorical_accuracy = history_4.history['val_sparse_categorical_accuracy']

plt.figure(figsize=(12,5))
plt.subplot(121)
plt.plot(loss_train_val,label='train')
plt.plot(loss_test_val,label='test')
plt.title("loss")
plt.xlabel("epoch")
plt.legend()
plt.subplot(122)
plt.plot(sparse_categorical_accuracy,label='train')
plt.plot(val_sparse_categorical_accuracy,label='test')
plt.title("sparse_categorical_accuracy")
plt.xlabel("epoch")
plt.legend()

plt.show()
运行结果:
准确率和损失值都区域一定的值,训练集与验证集大致符合,训练效果不错。
第五步:调用模型
new_model = tf.keras.models.load_model('.\\tmp\\model_4_794.h5')使用模型进行预测:
# 预测照片
pre = new_model.predict(y[:20])
同时生成0~10(不包括10)的数组备用
tik = [i for i in range(0,10)]防止plt绘制中文时出现乱码,指定画布大小
# 防止中文乱码
plt.rcParams['font.sans-serif'] = ['SimHei']

# 设置画布大小
plt.figure(figsize=(12,40))
第六步:分栏可视化
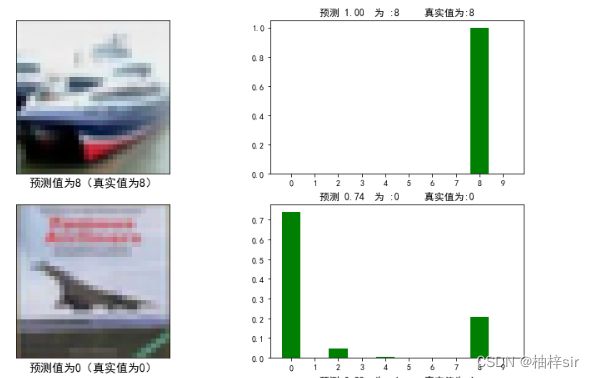
获取预测标签与真实标签,若预测正确则绘制柱状图为绿色,若绘制错误则绘制柱状图为红色。
左侧绘制为预测图片,标题为预测值与真实值
右侧绘制为预测概率柱状图,标题为预测概率与预测值
for i in range(1,20,2):

    # 真实值标签
    rel_lable = int(y_lable[i])
    pre_lable = np.argmax(pre[i])

    if rel_lable==pre_lable:
        color_s = 'g'
    else:
        color_s = 'r'


    # 绘制预测图片
    plt.subplot(10,2,i)
    plt.imshow(y[i])
    plt.xticks([])
    plt.yticks([])

    plt.xlabel(f'预测值为{pre_lable}(真实值为{rel_lable})',size=14)


    # 绘制标签
    plt.subplot(10,2,i+1)

    # 预测值标签
    plt.bar(tik,pre[i],color=color_s)
    plt.xticks(tik)
    plt.title(f"预测 %.2f  为 :{np.argmax(pre[i])}     真实值为:{rel_lable}"%(np.max(pre[i])))

plt.show()
部分运行结果:
PS:
制作不易,一键三连。


