【经济模型】CAPM模型实例验证
CAPM模型,全称为Capital Asset Pricing Model
E ( R t ) − R f = β × [ E ( R M t ) − R f ] E(R_t)-R_f=\beta \times [E(RM_t)-R_f] E(Rt)−Rf=β×[E(RMt)−Rf]
验证CAPM模型是否成立,代码示例如下:
选用数据源为聚宽,以600000.XSHG,600352.XSHG,000001.XSHG,000012.XSHG数据为例。
获取数据
from jqdatasdk import *
auth('用户名', '密码')
is_auth=is_auth()
print(is_auth)
stock_ids=["600000.XSHG","600352.XSHG","000001.XSHG","000012.XSHG"]
for stock_id in stock_ids:
    print(stock_id)
    stock_price=get_bars(stock_id,50,unit='1M',fields=['date','open','high','low','close'],end_dt='2020-06-01')
    stock_price.to_csv(stock_id+".csv")
    print(stock_price)
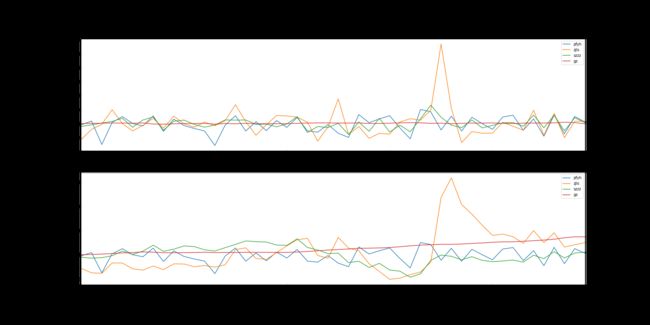
计算月度收益率曲线
import os
import time,datetime
import pandas as pd
import numpy as np
import matplotlib.pyplot as plt
from sklearn.linear_model import LinearRegression
import statsmodels.api as sm
def log_ret(x):
    test=x.map(lambda x:np.log(1+x/100))
    return (np.exp(test.sum())-1)

def get_cum_ret(ret):
    cum_ret=ret.copy()
    for i in range(len(ret)):
        for j in range(ret.shape[1]-1):
            cum_ret.iloc[i,j+1]=log_ret(ret.iloc[:i+1,j+1])*100
    return cum_ret

fig=plt.figure(figsize=(24,12))
ax1=fig.add_subplot(2,1,1)
ax2=fig.add_subplot(2,1,2)
ax1.set_title("monthly return")
ax2.set_title("cumalated return")
stock_ids=["600000.XSHG","600352.XSHG","000001.XSHG","000012.XSHG"]
stock_names=['pfyh','zjls','szzz','gz']
df=pd.DataFrame()

for i in range(len(stock_ids)):
    stock_id=stock_ids[i]
    stock_name=stock_names[i]
    data=pd.read_csv(stock_id+".csv",index_col="date")
    df[stock_name]=(data["close"]-data["open"])/data["open"]*100
df_cumulate=get_cum_ret(df)

df.to_csv("stock_returns.csv")
df_cumulate.to_csv("stock_cumulative_returns.csv")
#draw return graph
df.plot(ax=ax1)
df_cumulate.plot(ax=ax2)
ax1.legend()
ax2.legend()
plt.show()
fig.savefig("ret.png")
计算相关系数
#calculate the correlation
def get_cov(ret):
    data=ret.iloc[:,[1,2]]/100
    print("data is",data)
    output=pd.DataFrame()
    output['average']=data.mean()
    output['variance']=data.var()
    output['stdvariance']=data.std()
    covxy=np.cov(data.iloc[:,0].values,data.iloc[:,1].values)
    coefxy=np.corrcoef(data.iloc[:,0].values,data.iloc[:,1].values)
    output['covariance']=[np.NaN,covxy[0,1]]
    output['rcoefficient']=[np.NaN,coefxy[0,1]]
    return output
df=pd.read_csv("stock_returns.csv")
print("Ans3:correlation of two stocks(浦发银行、浙江龙盛)")
cov=get_cov(df)
print(cov)
CAPM模型计算
#4.capm estimation
ret=pd.read_csv("stock_returns.csv")
#iloc[:,[1,2,3,4]]-->'pfyh','zjls','szzz','gz'
x=ret.iloc[:,[1,3]]
x.columns=["constant_term","market_abnormal_return"]
x["constant_term"]=1
x["market_abnormal_return"]=ret.iloc[:,3]-ret.iloc[:,4]#x is the abnormal return of szzz
y1=ret.iloc[:,1]-ret.iloc[:,4]#y1 is the abnormal return of pfyh
print(x.head())
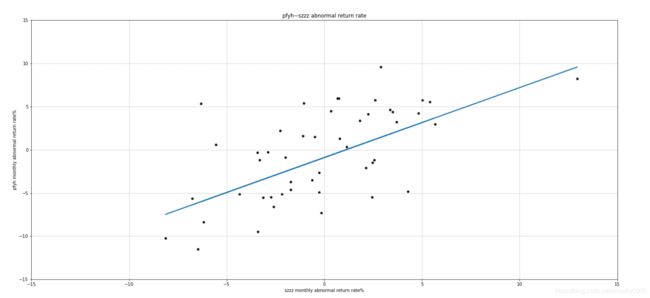
fig2=plt.figure(figsize=(24,24))
ax1=fig2.add_subplot(2,1,1)
ax1.set_title("pfyh~szzz abnormal return rate")
ax1.scatter(x.iloc[:,1],y1,s=30,c='black',marker='o',alpha=0.9,linewidths=0.3,label="scatter_points_graph")
ax1.set_xlim(-15,15)
ax1.set_ylim(-15,15)
reg1=LinearRegression().fit(x,y1)
pred1=reg1.predict(x)
ax1.plot(x.iloc[:,1],pred1,linewidth=2,label="pfyh-SCL")
ax1.grid(ls='--')
ax1.set_xlabel('szzz monthly abnormal return rate%')
ax1.set_ylabel('pfyh monthly abnormal return rate%')

y2=ret.iloc[:,2]-ret.iloc[:,4]
ax2=fig2.add_subplot(2,1,2)
ax2.scatter(x.iloc[:,1],y2,s=30,c='black',marker='o',alpha=0.9,linewidths=0.3,label="scatter_points_graph")
ax2.set_xlim(-15,15)
ax2.set_ylim(-15,15)
reg2=LinearRegression().fit(x,y2)
pred2=reg2.predict(x)
ax2.plot(x.iloc[:,1],pred2,linewidth=2,label="zjls-SCL")
ax2.grid(ls='--')
ax2.set_xlabel('szzz monthly abnormal return rate%')
ax2.set_ylabel('zjls monthly abnormal return rate%')
ax2.set_title("zjls~szzz abnormal return rate")
plt.show()
fig2.savefig("capm.png")
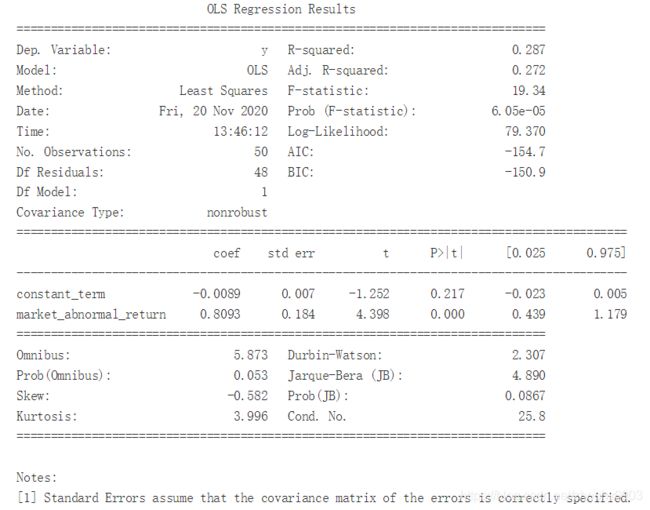
计算 α \alpha α和 β \beta β
#5.alpha & beta
def get_OLS1(ret):
    x=ret.iloc[:,[1,4]]
    x.columns=["constant_term","market_abnormal_return"]
    x["constant_term"]=1
    x["market_abnormal_return"]=(ret.iloc[:,3]-ret.iloc[:,4])/100#x is the abnormal return of szzz
    y1=(ret.iloc[:,1]-ret.iloc[:,4])/100
    X=sm.add_constant(x)
    model1=sm.OLS(y1,x)
    model1=model1.fit()
    return model1

def get_OLS2(ret):
    x=ret.iloc[:,[2,4]]
    x.columns=["constant_term","market_abnormal_return"]
    x["constant_term"]=1
    x["market_abnormal_return"]=(ret.iloc[:,3]-ret.iloc[:,4])/100#x is the abnormal return of szzz
    y2=(ret.iloc[:,2]-ret.iloc[:,4])/100
    X=sm.add_constant(x)
    model2=sm.OLS(y2,x)
    model2=model2.fit()
    return model2

ret=pd.read_csv("stock_returns.csv")
model1=get_OLS1(ret)
model2=get_OLS2(ret)
print(model1.summary())
print(model2.summary())


