【MATLAB100个实用小技巧】——图形应用(1-10)
文章目录
- 前言
- 1. 三角函数曲线(1)
- 2. 三角函数曲线(2)
- 3. 曲线的叠加
- 4. 双y轴图形的绘制
- 5. 单个窗口显示多个图形
- 6. 图形标注
- 7. 条形图形
- 8. 区域图形
- 9. 饼图的绘制
- 10. 阶梯图
前言
MATLAB是一个功能强大的软件,我们可以利用MATLAB进行绘图、算法验证、仿真实验等等。在学习MATLAB的过程中,繁多的命令与代码往往容易使我们脑容量过载
本系列将总结一些常见的MATLAB编程小技巧
可能有些地方会有些错误或者是不太完善的,还请大家在评论区直接指出❤️❤️❤️
1. 三角函数曲线(1)
代码
function Curve_sin
h0 = figure('ToolBar','none','Position',[150 250 500 400],'name','Curve of sin()');
h1 = axes('Parent',h0,'Visible','off');
x = -pi :0.01:pi;
y = sin(x);
plot(x,y);
xlabel('x');
ylabel('y');
title('Curve of sin()');
grid on;
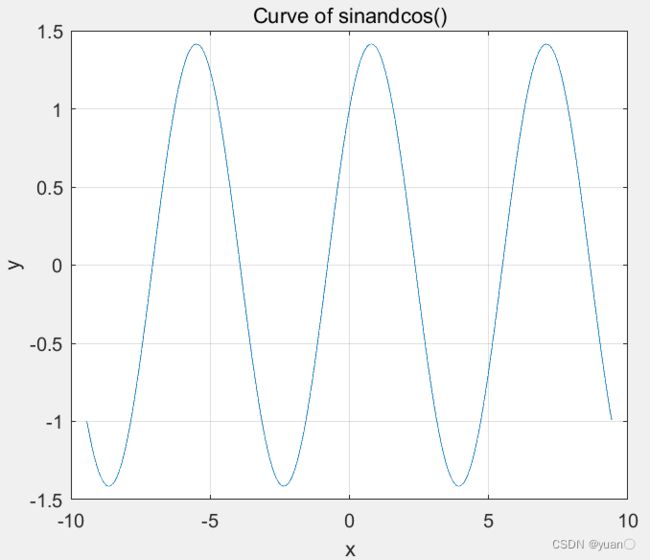
2. 三角函数曲线(2)
代码
function Curve_sin_and_cos
h0 = figure('ToolBar','none','Position',[150 250 500 400],'name','Curve of sinandcos()');
x = -3*pi :0.01:3*pi;
y = sin(x)+cos(x);
plot(x,y);
xlabel('x');
ylabel('y');
title('Curve of sinandcos()');
grid on;
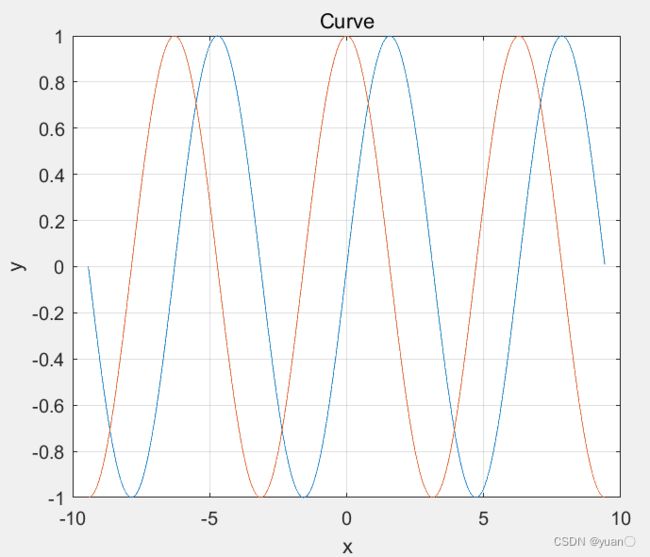
3. 曲线的叠加
重点hold on
代码
function Curve_add
h0 = figure('ToolBar','none','Position',[150 250 500 400],'name','Curve of sinandcos()');
x = -3*pi :0.01:3*pi;
y1 = sin(x);
y2 = cos(x);
plot(x,y1);
hold on;
plot(x,y2);
xlabel('x');
ylabel('y');
title('Curve');
grid on;
直接用plot(x,y1,x,y2)更简洁
function Curve_add
h0 = figure('ToolBar','none','Position',[150 250 500 400],'name','Curve of sinandcos()');
x = -3*pi :0.01:3*pi;
y1 = sin(x);
y2 = cos(x);
plot(x,y1,x,y2);
xlabel('x');
ylabel('y');
title('Curve');
grid on;
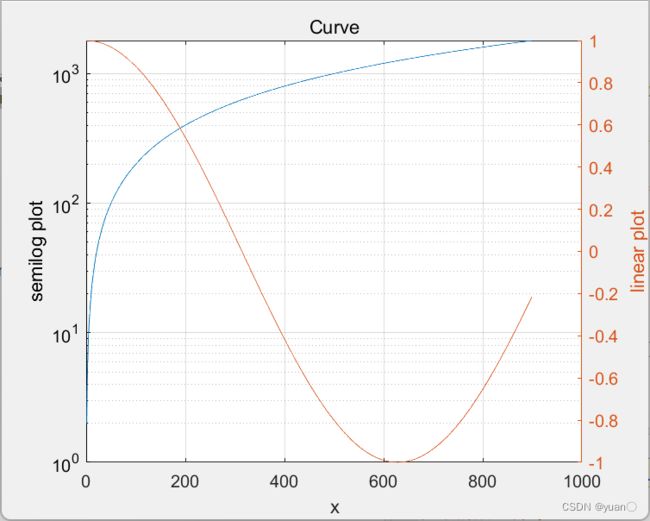
4. 双y轴图形的绘制
重点 plotyy() yyaxis←此处有链接
代码
function shuangzhou
h0 = figure('ToolBar','none','Position',[150 250 500 400],'name','shuangzhou');
x = 0:900;
a = 2;
b = 0.005;
y1 = a*x;
y2 = cos(b*x);
%一种方案
% [haxes,hline1,hline2]= plotyy(x,y1,x,y2,'semilogy','plot');
% axes(haxes(1));
% ylabel('semilog plot');
% axes(haxes(2));
% ylabel('linear plot');
% xlabel('x');
% title('Curve');
% 另一种方案
semilogy(x,y1);
yyaxis left;
ylabel('semilog plot');
xlabel('x');
title('Curve');

hold on;
yyaxis right;
plot(x,y2);
ylabel('linear plot');
grid on;
5. 单个窗口显示多个图形
重点 subplot←此处有链接
代码
function subplotCode
subplot(2,2,1);
x = linspace(-3.8,3.8);
y_cos = cos(x);
plot(x,y_cos);
title('Subplot 1: Cosine')

subplot(2,2,2);
y_poly = 1 - x.^2./2 + x.^4./24;
plot(x,y_poly,'r');
title('Subplot 2: Polynomial')

subplot(2,2,[3,4]);
plot(x,y_cos,'b',x,y_poly,'r');
title('Subplot 3 and 4: Both')
grid on;
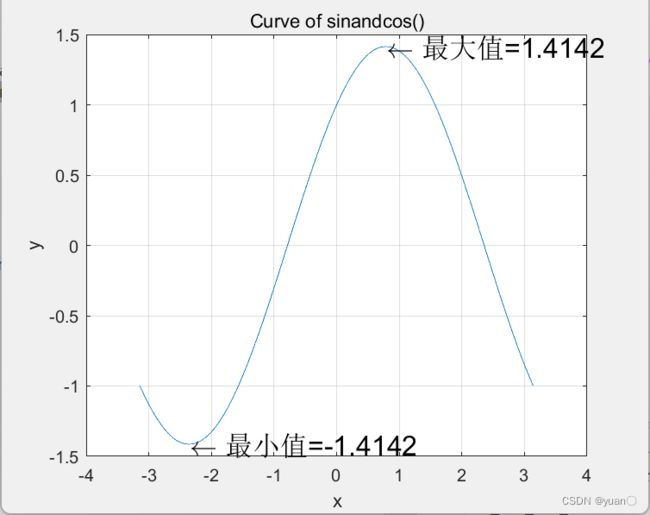
6. 图形标注
重点 text()←此处有链接
代码
function Curve_sin_and_cos
h0 = figure('ToolBar','none','Position',[150 250 500 400],'name','Curve of sinandcos()');
x = -1*pi :0.01:1*pi;
y = sin(x)+cos(x);
plot(x,y);
xlabel('x');
ylabel('y');
title('Curve of sinandcos()');
% 找到最小值
imin = find(min(y) == y);
% 找到最大值
imax = find(max(y) == y );
text(x(imin),y(imin),['\leftarrow 最小值=',num2str(y(imin))],'FontSize',16);
text(x(imax),y(imax),['\leftarrow 最大值=',num2str(y(imax))],'FontSize',16);
grid on;
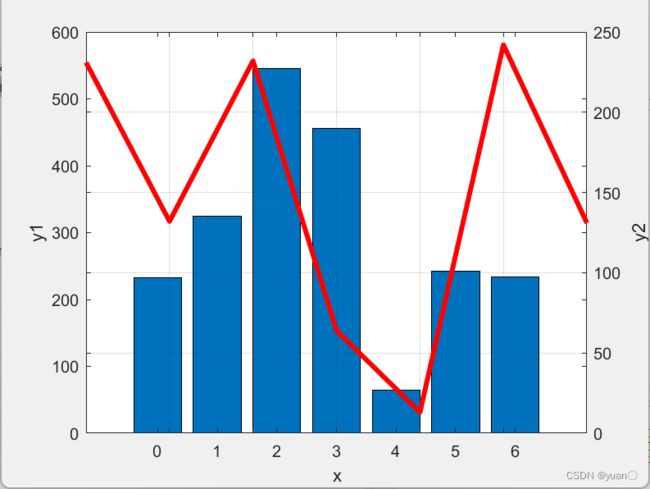
7. 条形图形
重点 bar && set()←此处有链接
代码
function Curve_sin_and_cos
h0 = figure('ToolBar','none','Position',[150 250 500 400],'name','Curve of sinandcos()');
tx1 = [233 324 545 456 64 242 234];
tx2 = [231 132 232 64 13 242 131];
a = 0:6;
bar(a,tx1);
xlabel('x');
ylabel('y1');
h1 = gca;
h2 = axes('Position',get(h1,'position'));
plot(a,tx2,"LineWidth",3,'color','r');
set(h2,"yaxislocation",'right','color','none',"xticklabel",[]);
ylabel('y2');
grid on;
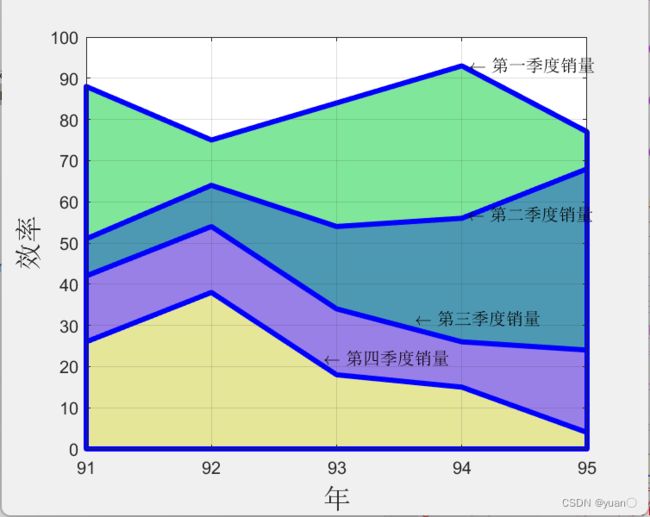
8. 区域图形
重点area←此处有链接
代码
function Curve_sin_and_cos
h0 = figure('ToolBar','none','Position',[150 250 500 400],'name','Curve of sinandcos()');
x = 91:95;
profist1 = [88 75 84 93 77];
profist2 = [51 64 54 56 68];
profist3 = [42 54 34 26 24];
profist4 = [26 38 18 15 4];
area(x,profist1,"FaceColor",[0.5 0.9 0.6],"EdgeColor",'b',"LineWidth",3);
hold on;
area(x,profist2,"FaceColor",[0.3 0.6 0.7],"EdgeColor",'b',"LineWidth",3);
hold on;
area(x,profist3,"FaceColor",[0.6 0.5 0.9],"EdgeColor",'b',"LineWidth",3);
hold on;
area(x,profist4,"FaceColor",[0.9 0.9 0.6],"EdgeColor",'b',"LineWidth",3);
hold off;
set(gca,'xtick',[91:95]);
set(gca,'layer',"top");
gtext('\leftarrow 第一季度销量');
gtext("\leftarrow 第二季度销量");
gtext("\leftarrow 第三季度销量");
gtext("\leftarrow 第四季度销量");
xlabel("年",'FontSize',16);
ylabel("效率",'FontSize',16);
grid on;
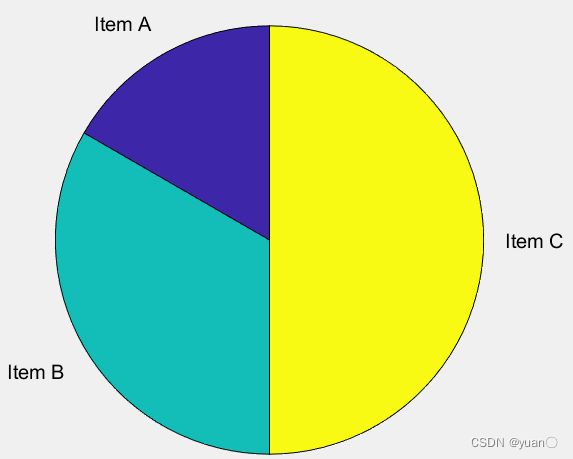
9. 饼图的绘制
重点 pie←此处有链接
代码
%% 创建带有简单文本标签的饼图
x = [1,2,3];
pie(x,{'Item A','Item B','Item C'})
figure
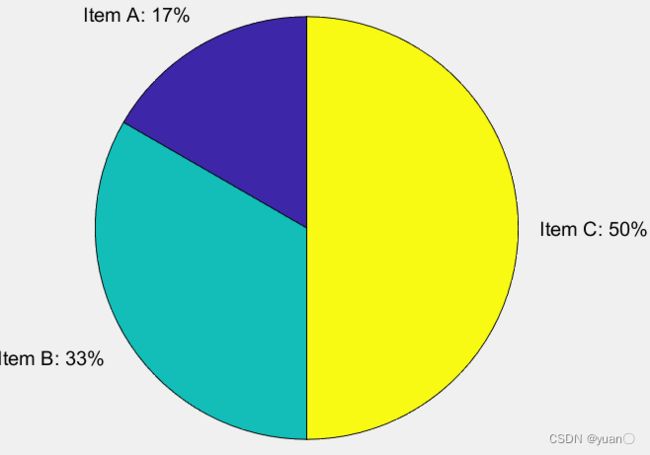
%% 带百分比和文本的标签
x = [1,2,3];
p = pie(x);
pText = findobj(p,'Type','text');
percentValues = get(pText,'String');
txt = {'Item A: ';'Item B: ';'Item C: '};
combinedtxt = strcat(txt,percentValues);
pText(1).String = combinedtxt(1);
pText(2).String = combinedtxt(2);
pText(3).String = combinedtxt(3);
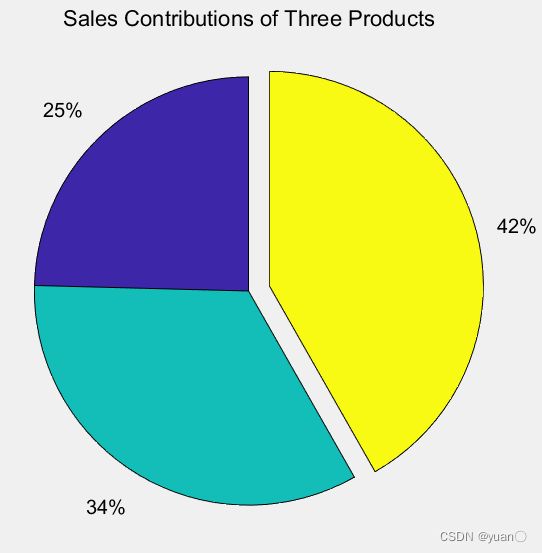
%% 偏移占比最大的饼图扇区
X = [19.3, 22.1, 51.6
     34.2, 70.3, 82.4
     61.4, 82.9, 90.8
     50.5, 54.9, 59.1
     29.4, 36.3, 47.0];
 product_totals = sum(X);
 [c,ind] = max(product_totals);
 explode = zeros(1,3);
 explode(ind) = 1;
 figure
pie(product_totals,explode)
title('Sales Contributions of Three Products')
%% 向饼图添加图例
x = [1,2,3];
figure
pie(x)
labels = {'Product A','Product B','Product C'};
legend(labels,'Location','southoutside','Orientation','horizontal')
10. 阶梯图
重点stair←此处有链接
代码
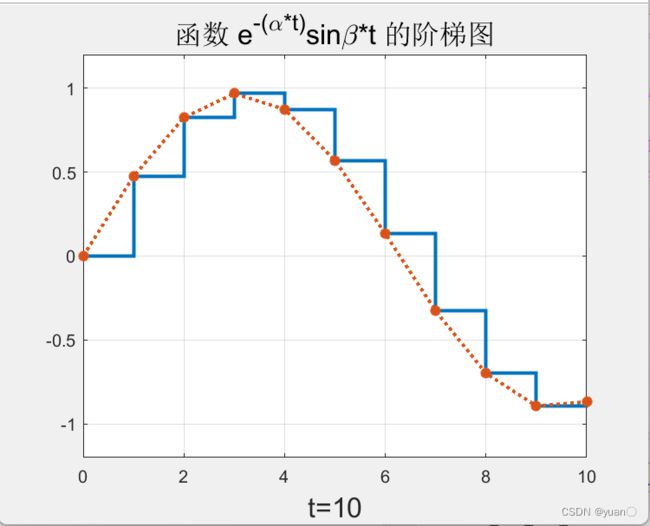
function Curve_sin_and_cos
h0 = figure('ToolBar','none','Position',[150 250 500 400],'name','Curve of sinandcos()');
a = 0.01;
b = 0.5;
t = 0:10;
f = exp(-a*t).*sin(b*t);
stairs(t,f,'LineWidth',2);
hold on;
plot(t,f,":*",'LineWidth',2);
hold off;
title('函数 e^{-(\alpha*t)}sin\beta*t 的阶梯图','fontsize',16);
xlabel('t=10','fontsize',16);
axis([0 10 -1.2 1.2]);
grid on;


