LDA代码案例
目录
- Ⅰ线性判别分析
- Ⅱ使用sklearn库实现LDA
-
- 生成数据
- 处理数据
- LDA分类
-
- 训练集图像
- 测试集图像
- 小结
- 链接
Ⅰ线性判别分析
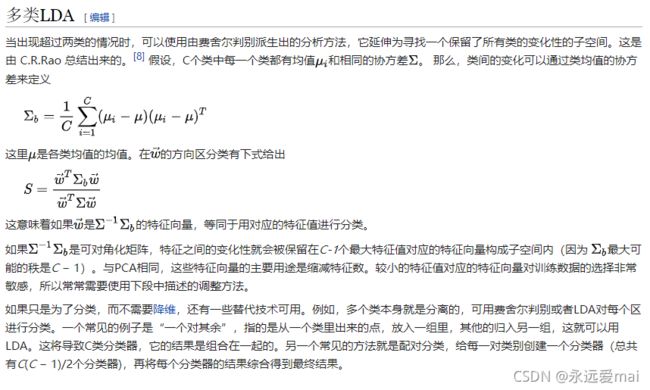
**线性判别分析 (LDA)**是对费舍尔的线性鉴别方法的归纳,这种方法使用统计学,模式识别和机器学习方法,试图找到两类物体或事件的特征的一个线性组合,以能够特征化或区分它们。所得的组合可用来作为一个线性分类器,或者,更常见的是,为后续的分类做降维处理。
(wikipedia)
在实际中,类的均值和协方差都是未知的。然而,它们可以从训练集合中估算出来。最大似然估计和最大后验概率估计都可以用来替代上述方程里面的相应值。虽然协方差的估值在某种意义上是最优的,即使对类的正态分布假设是正确的,也并不能表明用这些估值替换得到的判别是最优的。
一般应用于破产预测、破产预测、市场营销、生物医学研究和地球科学等
Ⅱ使用sklearn库实现LDA
生成数据
#生成200个样本
import numpy as np
import pandas as pd
import matplotlib.pyplot as plt
from matplotlib.colors import ListedColormap
from sklearn.datasets import make_classification
x, y = make_classification(n_samples=200, n_features=2, n_redundant=0, n_classes=2, n_informative=2,n_clusters_per_class=2,class_sep =1, random_state =0)
fig = plt.figure()
plt.scatter(x[:, 0], x[:, 1], c=y)
处理数据
#设置分类平滑度
h = .01
#设置X和Y的边界值
x_min, x_max = x[:, 0].min() - 1, x[:, 0].max() + 1
y_min, y_max = x[:, 1].min() - 1, x[:, 1].max() + 1

#使用meshgrid函数返回X和Y两个坐标向量矩阵
xx, yy = np.meshgrid(np.arange(x_min, x_max,h), np.arange(y_min, y_max,h))
Z = lda.predict(np.c_[xx.ravel(), yy.ravel()])
#划分数据集
from sklearn.model_selection import train_test_split
x_train,x_test,y_train,y_test = train_test_split(x, y, random_state=33, test_size=0.25)
LDA分类
#使用LDA进行降维
from sklearn.discriminant_analysis import LinearDiscriminantAnalysis
from sklearn.linear_model import LogisticRegression
lda = LinearDiscriminantAnalysis(n_components=1)

x_train_lda = lda.fit_transform(x_train, y_train)  # LDA是有监督方法,需要用到标签
x_test_lda = lda.fit_transform(x_test, y_test)   # 预测时候特征向量正负问题,乘-1反转镜像
训练集图像
#设置colormap颜色
cm_bright = ListedColormap(['#D9E021', '#0D8ECF'])
#绘制数据点
plt.scatter(x_train[:, 0], x_train[:, 1], c=y_train, cmap=cm_bright)
plt.title('Linear Discriminant Analysis Classifiers')
plt.axis('tight')
plt.show()
测试集图像
plt.title('Linear Discriminant Analysis Classifiers')
plt.scatter(x_test[:, 0], x_test[:, 1], c=y_test, cmap=cm_bright)
plt.show()
小结
LDA算法为后续的分类做降维处理有很大的帮助。
链接
Python机器学习笔记:线性判别分析(LDA)算法


