时间序列ARMA和ARIMA模型(一)
读取数据(tushare数据)
import tushare as ts
ts.set_token('3fd7b7e92cd059d0f192177e61afd8da6f84e3476cff01f076d5e295')
#在tushare官网注册即可获得
pro=ts.pro_api()#初始化pro接口
data=pro.daily(ts_code='00000.1sz',start_data='20210428',end_data='20210428')
#根据时间段获取招商银行日交易数据
data.sort_values(by='trade_date',inplace=True)
#根据交易日默认升序排列
data.reset_index(drop=True,inplace=True)

data
数据预处理
data=data.iloc[1:]
#从第一行开始索引,包括所有列
data=data.fillna(method='ffill')
#用后一时刻的观测值对缺失值进行填补
data.head()
#显示数据前五行
二维数据可视化
import matplotlib.pyplot as plt
data=data[['trade_date','open','close','high','low']]
data.plot(subplots=True,figsize=(10,12))
#多子图,图片尺寸宽10,长12
plt.title('zhapshang stock attributes from 2010-01-10 to 2020-01-10')
plt.savefig('stocks.png')
plt.show()

平稳性检验
from statsmodels.tsa.stattools import adfuller as ADF
diff=0
adf=ADF(data['close'])
if adf[1]>0.05:#adf[1]是p值,p值小于0.05平稳
    print(u'原始数据列经检验不平稳,p值为:%s'%(adf[1]))
else:
    print(u'原始数据列经检验平稳,p值为:%s'%(adf[1]))
纯随机性检验
from statsmodels.stats.diagnostic import acorr_ljungbox
[[lb], [p]] = acorr_ljungbox(data['close'], lags = 1)
#lag是残差延迟个数
if p<0.05:
    print(u'原始数据列非白噪声序列,p值为:%s'%p)
else:
    print(u'原始数据列为白噪声序列,p值为:%s'%p)
模型识别与定阶
import matplotlib.pyplot as plt
data=data[['trade_date','open','close','high','low']]
data.plot(subplots=True,figsize=(10,12))
plt.title('zhapshang stock attributes from 2010-01-10 to 2020-01-10')
plt.savefig('stocks.png')
plt.show()

import pandas as pd
from statsmodels.graphics.tsaplots import plot_acf, plot_pacf


def plotds(xt, nlag=30, fig_size=(12, 10)):
    if not isinstance(xt, pd.Series):
        xt=pd.Series(xt)
    plt.figure(figsize=fig_size)
    layout = (2,2)

    ax_xt = plt.subplot2grid(layout,(0,0),colspan=2)
    ax_acf = plt.subplot2grid(layout,(1,0))
    ax_pacf = plt.subplot2grid(layout,(1,1))

    xt.plot(ax=ax_xt)
    ax_xt.set_title('Time Series')
    plot_acf(xt,lags=nlag,ax=ax_acf)
    plot_pacf(xt,lags=nlag,ax=ax_pacf)
    plt.tight_layout()
    return None

plotds(data['close'].dropna(), nlag=50)
plt.show()
自相关和偏相关函数都是拖尾的,所以选择ARMA模型
图:

import statsmodels.tsa.api as smtsa

data_df=data.copy()
print(data_df)
aicVal=[]
for ari in range(1,3):
    for maj in range(0,5):
        try:
            arma_obj=smtsa.ARMA(data_df.close.tolist(), order=(ari,maj))\
            .fit(maxlag=30,method='mle', trend='nc')
            #尝试计算不同p、q的AIC值,选取最小AIC值
            aicVal.append([ari, maj, arma_obj.aic])
        except Exception as e:
            print(e)
#最小p、q组合为(2,2)
from statsmodels.tsa.arima_model import ARMA
arma_obj_fin=smtsa.ARMA(data_df.close.tolist(),order=(2,2))\
.fit(maxlag=30, method='mle', trend='nc',disp=False)
#'mle'最大似然估计方法
print(arma_obj_fin.summary())
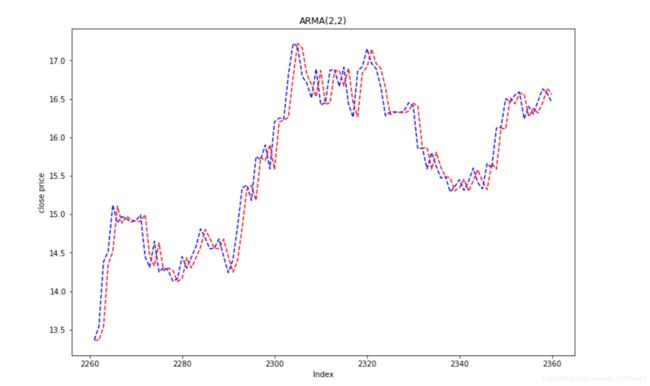
模型拟合与预测
data_df['ARMA']=arma_obj_fin.predict()
#将拟合结果储存到data_df变量,列名命名为ARMA
f,axarr=plt.subplots(1,sharex=True)
#共享x轴,子图行列数为1
f.set_size_inches(12,8)
data_df['close'].iloc[len(data_df)-100:]\
.plot(color='b',linestyle='-',ax=axarr)
#画出末尾至往前100的'close'实际图
data_df['ARMA'].iloc[len(data_df)-100:]\
.plot(color='r',linestyle='--',ax=axarr)
#画出末位至往前100的预测图
axarr.set_title('ARMA(2,2)')
plt.xlabel('Index')
plt.ylabel('close price')
plt.show()
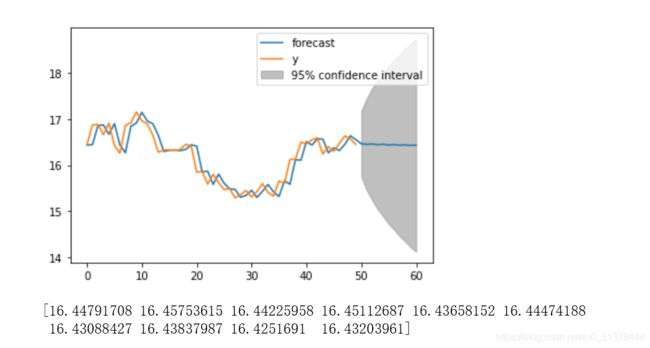
fig=arma_obj_fin.plot_predict(len(data_df)-50,len(data_df)+10)
plt.show()
predict=arma_obj_fin.predict(start=1,end=len(data_df)+10)
print(predict[len(predict)-10:])
输出末尾10个预测值