光谱数据作图
发现光谱仪配套的软件在半高宽的计算上好像有些问题,试了试python能不能解决。
目录
1.光谱原图
2.光谱数据标准化
3.光谱标注峰值和半高宽
1.光谱原图
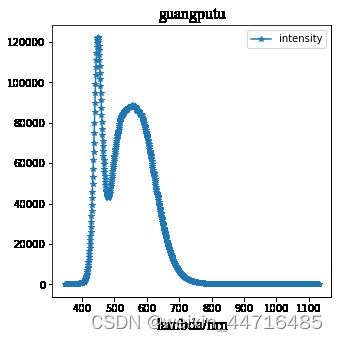
首先,导入光谱数据,做图;
import pandas as pd
import matplotlib.pyplot as plt


df1 = pd.read_excel('D:/desktop/data.xlsx')#读取.xlsx文件
data = df1.values #data为除了第一行以外的数据
print(data.shape) #查看data的size

WL = data[:,0]
Intensity = data[:,1]

font1 = {'family' : 'Times New Roman',
'weight' : 'normal',
'size'   : 16,
}
plt.figure(figsize=(5,5))
plt.title('guangputu',font1)
plt.xlabel('lambda/nm',font1)
plt.plot(WL,Intensity,'-*')
plt.legend(['intensity'])
plt.show()
运行结果:(1044,2)
2.光谱数据标准化
起初,出现了这样的问题
from sklearn.preprocessing import MinMaxScaler
scaler = MinMaxScaler(feature_range=(0, 1))  #将数据归一到0到1
Intensity = scaler.fit_transform(Intensity)
plt.figure(figsize=(5,5))
plt.title('biaozhunhua',font1)
plt.xlabel('lambda/nm',font1)
plt.plot(WL,Intensity,'-*')
plt.legend(['intensity'])
plt.show()
将scaler.fit_transform(Intensity)按报错要求改为scaler.fit_transform(Intensity.reshape(-1,1)),又出现如下错误,
这里,注意到x,y的维度不对应,这里修改为:
from sklearn.preprocessing import MinMaxScaler
scaler = MinMaxScaler(feature_range=(0, 1))  #将数据归一到0到1
Intensity = (scaler.fit_transform(Intensity.reshape(-1, 1))).reshape(-1)
plt.figure(figsize=(5,5))
plt.title('biaozhunhua',font1)
plt.xlabel('lambda/nm',font1)
plt.plot(WL,Intensity,'-*')
plt.legend(['intensity'])
plt.show()
运行结果为
3.光谱标注峰值和半高宽
先观察光谱有几个峰和位置,有两个峰,位置分别为400-500 500-700 ,第二个峰不确定是否有半高宽,但是我们可以根据计算结果判断。
这里现将WL和Intensity类型转化为列表,因为这里光谱数据的波长分辨率不均匀,所以这里穷举一下,估个大致位置就可以了:
WL = list(WL)
Intensity = list(Intensity)
print(WL[190]) #496.949
print(WL[450]) #696.031
计算半高宽:
max1 = max(Intensity[0:190])
# print(max1,data.index(max1))
# print(data[289:349])
WL_range1 = [x for x in range(0,190)if Intensity[x]>max1/2]
print(WL_range1)
print(min(WL_range1),max(WL_range1))#111 151
HW1 = WL[max(WL_range1)]-WL[min(WL_range1)]#半高宽
center1 = Intensity.index(max1)#最大值的横坐标索引
print(HW1,center1,max1)#31.194000000000017 128 1.0

max2 = max(Intensity[170:450])
WL_range2 = [x for x in range(170,450)if Intensity[x]>max2/2]
print(WL_range2)
print(min(WL_range2),max(WL_range2))#174 365
HW2 = WL[max(WL_range2)]-WL[min(WL_range2)]
center2 = Intensity.index(max2)
print(HW2,center2,max2)#146.97600000000006 264 0.7260080266137009
print(Intensity[174])#0.36640428957929755
可以看到第二个峰的半高宽最小索引为174,大于第一个峰的峰值索引128, 因此可以认为第二个峰是符合的。
接下来画图:
plt.figure(figsize=(10,10))
plt.title('guiyihua_FWHM ',font1)
plt.xlabel('lambda/nm',font1)
plt.plot(WL,Intensity,marker='*',color='blue')
plt.text(WL[128],Intensity[128],(WL[128],Intensity[128],HW1),fontsize=20,color='red',verticalalignment='center',horizontalalignment='right')
plt.plot(WL[128],Intensity[128],marker='*',color='r')
plt.text(WL[264],Intensity[264],(WL[264],Intensity[264],HW1),fontsize=20,color='red',verticalalignment='center',horizontalalignment='right')
plt.plot(WL[264],Intensity[264],marker='*',color='r')
plt.legend()
plt.show()
运行结果为:


