机器学习实战(四):逻辑斯蒂回归
机器学习实战:逻辑斯蒂回归
- 1、关于逻辑斯蒂回归
-
- 1.1 一般过程
- 1.2 优缺点
- 1.3 Sigmoid函数
- 2、基于最优化方法的最佳回归系数确定
-
- 2.1 梯度上升法
-
- 2.1.1 主要思想
- 2.1.2 Logistic回归梯度上升优化算法
- 2.1.3 绘制决策边界
- 2.1.4 随机梯度上升
- 2.1.5 改进的随机梯度上升
- 3. 示例:从疝气病症预测病马的死亡率
- 4.课外例子
- 5. 总结
1、关于逻辑斯蒂回归
1.1 一般过程
- 收集数据:
- 准备数据
- 分析数据
- 训练算法
- 测试算法
- 使用算法
1.2 优缺点
优点 :计算代价不高,易于理解和实现
缺点 :容易欠拟合,分类精度可能不高
使用数据类型:数值型和标称型数据
1.3 Sigmoid函数
Sigmoid函数是一种阶跃函数( step function )。在数学中,如果实数域上的某个函数可以用半开区间上的指示函数的有限次线性组合来表示,那么这个函数就是阶跃函数。而数学中指示函数(indicator function)是定义在某集合X上的函数,表示其中有哪些元素属于某一子集A。
具体计算公式为:
![]()
为了实现Logistic回归分类器,我们在每个特征上都乘以一个回归系数,然后把所有的结果值相加,将这个总和代人Sigmoid函数中,进而得到一个范围在0~1之间的数值。任何大于0.5的数据被分入1类,小于0.5即被归入0类。所以,Logistic回归也可以被看成是一种概率估计。
2、基于最优化方法的最佳回归系数确定
2.1 梯度上升法
2.1.1 主要思想
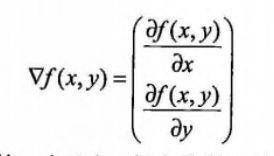
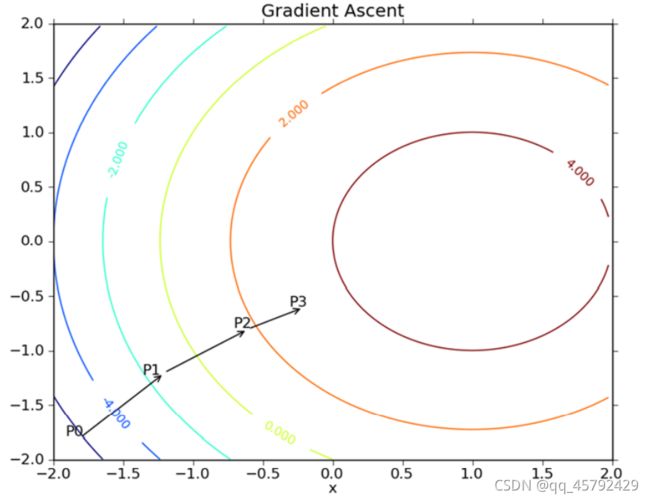
要找到某函数的最大值,最好的方法是沿着该函数的梯度方向探寻。
梯度上升算法到达每个点后都会重新估计移动方向。从P0开始,计算完该点的梯度,函数就根据梯度移动到P2。如此循环知道满足停止条件。
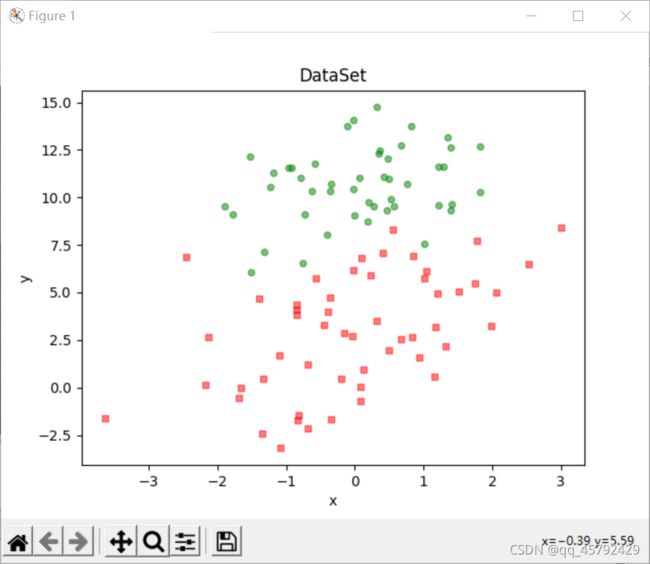
数据集的一个简单展示。
2.1.2 Logistic回归梯度上升优化算法
# 加载数据函数
def loadDataSet():
    dataMat = []        #创建数据列表
    labelMat = []       #创建标签列表
    fr = open('testSet.txt')        #打开文件
    for line in fr.readlines():     #逐行读取
        lineArr = line.strip().split()          #去除回车,放入列表
        dataMat.append([1.0,float(lineArr[0]), float(lineArr[1])])      #添加数据
        labelMat.append(int(lineArr[2]))            #添加标签
    fr.close()
    return dataMat,labelMat

#sigimod函数
def sigmoid(inX):
    return 1.0/(1+np.exp(-inX))

#梯度上升算法
def gradAscent(dataMatIn,classLabels):
    dataMatrix = np.mat(dataMatIn)              #转换成numpy的mat
    labelMat = np.mat(classLabels).transpose()  #转换后进行转置
    m,n = np.shape(dataMatrix)                  #返回dataMatrix的大小,m为函数,n为列数
    alpha = 0.001                               #移动步长
    maxCycles = 500                             #最大迭代次数
    weights = np.ones((n,1))
    for k in range(maxCycles):
        h = sigmoid(dataMatrix * weights)
        error = labelMat - h
        weights = weights + alpha * dataMatrix.transpose() * error
    return weights.getA()
结果:

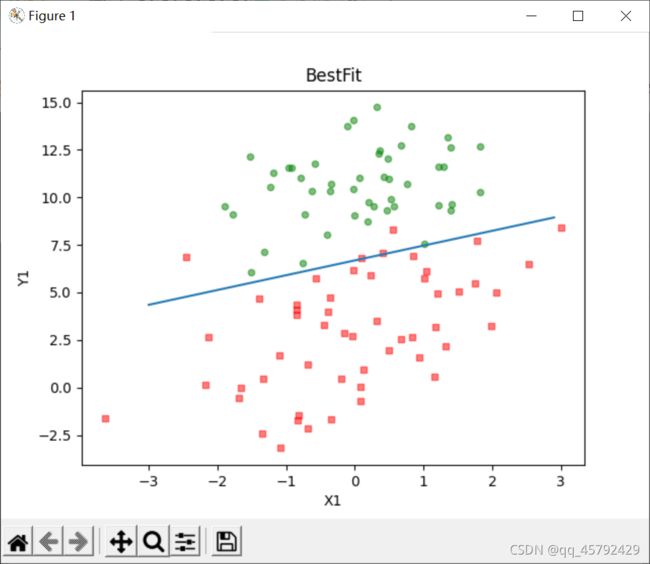
通过求解出的参数就可以确定不同类别数据之间的分割线,画出决策边界
2.1.3 绘制决策边界
代码
import matplotlib.pyplot as plt
import numpy as np

# 加载数据函数
def loadDataSet():
    dataMat = []        #创建数据列表
    labelMat = []       #创建标签列表
    fr = open('testSet.txt')        #打开文件
    for line in fr.readlines():     #逐行读取
        lineArr = line.strip().split()          #去除回车,放入列表
        dataMat.append([1.0,float(lineArr[0]), float(lineArr[1])])      #添加数据
        labelMat.append(int(lineArr[2]))            #添加标签
    fr.close()
    return dataMat,labelMat

#sigimod函数
def sigmoid(inX):
    return 1.0/(1+np.exp(-inX))

# 绘制数据集的函数
def plotDataSet(weights):
    dataMat, labelMat = loadDataSet()       #加载数据集
    dataArr = np.array(dataMat)             #转换为np数组
    n = np.shape(dataMat)[0]
    xcord1 = [] ; ycord1 = []               #正样本
    xcord2 = [] ; ycord2 = []               #负样本
    for i in range(n):                      #根据数据集标签进行分类
        if int(labelMat[i]) == 1:           #1为正样本
            xcord1.append(dataArr[i,1]);ycord1.append(dataArr[i,2])
        else:                               #0为负样本
            xcord2.append(dataArr[i,1]); ycord2.append(dataArr[i,2])
    fig = plt.figure()
    ax = fig.add_subplot(111)               #添加subplot
    #绘制正负样本
    ax.scatter(xcord1, ycord1, s = 20, c = 'red', marker='s',alpha=.5)
    ax.scatter(xcord2, ycord2, s = 20, c='green', alpha=.5)
    x = np.arange(-3.0,3.0,0.1)
    y = (-weights[0]-weights[1] * x) / weights[2]
    ax.plot(x,y)
    # plt.title('DataSet')
    # plt.xlabel('x'); plt.ylabel('y')
    plt.title('BestFit')
    plt.xlabel('X1');
    plt.ylabel('Y1')
    plt.show()

#梯度上升算法
def gradAscent(dataMatIn,classLabels):
    dataMatrix = np.mat(dataMatIn)              #转换成numpy的mat
    labelMat = np.mat(classLabels).transpose()  #转换后进行转置
    m,n = np.shape(dataMatrix)                  #返回dataMatrix的大小,m为函数,n为列数
    alpha = 0.001                               #移动步长
    maxCycles = 500                             #最大迭代次数
    weights = np.ones((n,1))
    for k in range(maxCycles):
        h = sigmoid(dataMatrix * weights)
        error = labelMat - h
        weights = weights + alpha * dataMatrix.transpose() * error
    return weights.getA()

if __name__ =='__main__':

    dataMat,labelMat = loadDataSet()
    weights = gradAscent(dataMat,labelMat)
    plotDataSet(weights)
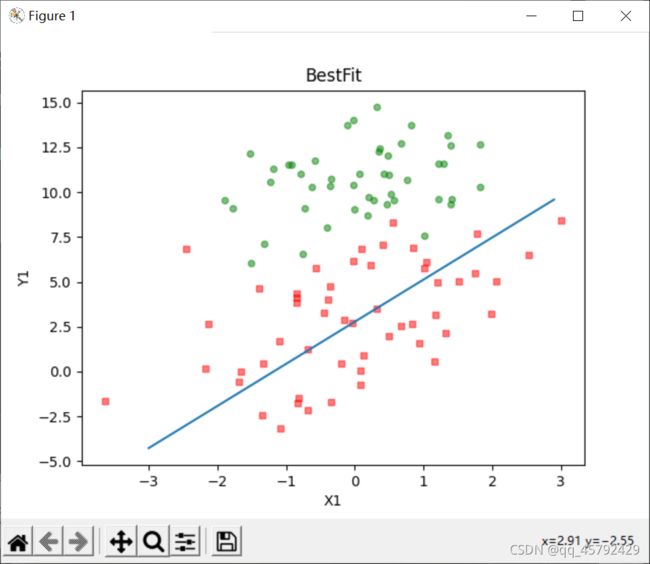
2.1.4 随机梯度上升
梯度上升算哒在每次更新回归系数时都需要遍历整个数据集(批处理),该方法的计算复杂度随着样本和特征的数量的增多而加大。因此我们使用随机梯度上升算法来改进。随机梯度算法是一个在线学习算法
代码:
import random
from matplotlib.font_manager import FontProperties
import matplotlib.pyplot as plt
import numpy as np

# 加载数据函数
def loadDataSet():
    dataMat = []        #创建数据列表
    labelMat = []       #创建标签列表
    fr = open('testSet.txt')        #打开文件
    for line in fr.readlines():     #逐行读取
        lineArr = line.strip().split()          #去除回车,放入列表
        dataMat.append([1.0,float(lineArr[0]), float(lineArr[1])])      #添加数据
        labelMat.append(int(lineArr[2]))            #添加标签
    fr.close()
    return dataMat,labelMat

#sigimod函数
def sigmoid(inX):
    return 1.0/(1+np.exp(-inX))

# 绘制数据集的函数
def plotDataSet(weights):
    dataMat, labelMat = loadDataSet()       #加载数据集
    dataArr = np.array(dataMat)             #转换为np数组
    n = np.shape(dataMat)[0]
    xcord1 = [] ; ycord1 = []               #正样本
    xcord2 = [] ; ycord2 = []               #负样本
    for i in range(n):                      #根据数据集标签进行分类
        if int(labelMat[i]) == 1:           #1为正样本
            xcord1.append(dataArr[i,1]);ycord1.append(dataArr[i,2])
        else:                               #0为负样本
            xcord2.append(dataArr[i,1]); ycord2.append(dataArr[i,2])
    fig = plt.figure()
    ax = fig.add_subplot(111)               #添加subplot
    #绘制正负样本
    ax.scatter(xcord1, ycord1, s = 20, c = 'red', marker='s',alpha=.5)
    ax.scatter(xcord2, ycord2, s = 20, c='green', alpha=.5)
    x = np.arange(-3.0,3.0,0.1)
    y = (-weights[0]-weights[1] * x) / weights[2]
    ax.plot(x,y)
    # plt.title('DataSet')
    # plt.xlabel('x'); plt.ylabel('y')
    plt.title('BestFit')
    plt.xlabel('X1');
    plt.ylabel('Y1')
    plt.show()

#梯度上升算法
def gradAscent(dataMatIn,classLabels):
    dataMatrix = np.mat(dataMatIn)              #转换成numpy的mat
    labelMat = np.mat(classLabels).transpose()  #转换后进行转置
    m,n = np.shape(dataMatrix)                  #返回dataMatrix的大小,m为函数,n为列数
    alpha = 0.001                               #移动步长
    maxCycles = 500                             #最大迭代次数
    weights = np.ones((n,1))
    for k in range(maxCycles):
        h = sigmoid(dataMatrix * weights)
        error = labelMat - h
        weights = weights + alpha * dataMatrix.transpose() * error
    return weights.getA()

def stocGradAscent0(dataMatrix,classLabels,numIter = 150):
    m,n = np.shape(dataMatrix)
    alpha = 0.01
    weights = np.ones(n)        #参数初始化
    for i in range(m):
        h = sigmoid(sum(dataMatrix[i]*weights))
        error = classLabels[i]-h
        weights = weights+alpha*error*dataMatrix[i]
    return weights


if __name__ =='__main__':

    dataMat,labelMat = loadDataSet()
    weights = stocGradAscent0(np.array(dataMat),labelMat)
    #weights = gradAscent(dataMat,labelMat)
    plotDataSet(weights)
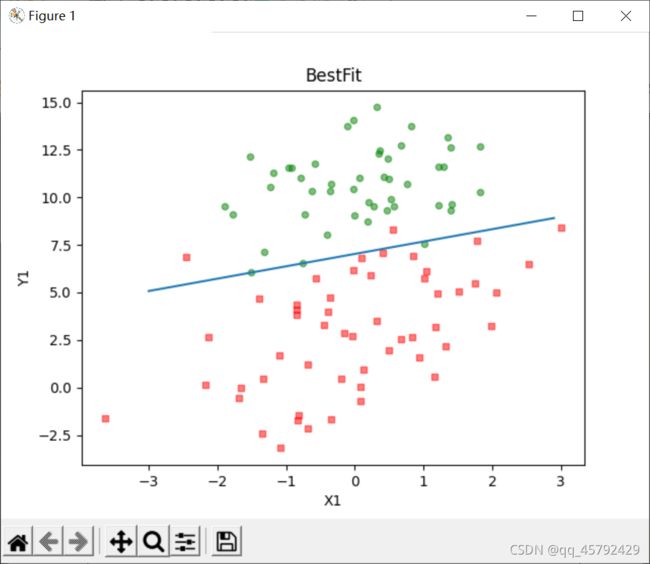
2.1.5 改进的随机梯度上升
在随机梯度上升算法中一些系数需要的迭代次数更多,并且大的波动停止后会产生一些小的周期性的波动。产生这种现象的原因是存在一些不能正确分类的样本点,在每次迭代时会引法系数的剧烈改变。而改进的随机梯度上升能解决这一问题
代码:
import random
from matplotlib.font_manager import FontProperties
import matplotlib.pyplot as plt
import numpy as np

# 加载数据函数
def loadDataSet():
    dataMat = []        #创建数据列表
    labelMat = []       #创建标签列表
    fr = open('testSet.txt')        #打开文件
    for line in fr.readlines():     #逐行读取
        lineArr = line.strip().split()          #去除回车,放入列表
        dataMat.append([1.0,float(lineArr[0]), float(lineArr[1])])      #添加数据
        labelMat.append(int(lineArr[2]))            #添加标签
    fr.close()
    return dataMat,labelMat

#sigimod函数
def sigmoid(inX):
    return 1.0/(1+np.exp(-inX))

# 绘制数据集的函数
def plotDataSet(weights):
    dataMat, labelMat = loadDataSet()       #加载数据集
    dataArr = np.array(dataMat)             #转换为np数组
    n = np.shape(dataMat)[0]
    xcord1 = [] ; ycord1 = []               #正样本
    xcord2 = [] ; ycord2 = []               #负样本
    for i in range(n):                      #根据数据集标签进行分类
        if int(labelMat[i]) == 1:           #1为正样本
            xcord1.append(dataArr[i,1]);ycord1.append(dataArr[i,2])
        else:                               #0为负样本
            xcord2.append(dataArr[i,1]); ycord2.append(dataArr[i,2])
    fig = plt.figure()
    ax = fig.add_subplot(111)               #添加subplot
    #绘制正负样本
    ax.scatter(xcord1, ycord1, s = 20, c = 'red', marker='s',alpha=.5)
    ax.scatter(xcord2, ycord2, s = 20, c='green', alpha=.5)
    x = np.arange(-3.0,3.0,0.1)
    y = (-weights[0]-weights[1] * x) / weights[2]
    ax.plot(x,y)
    # plt.title('DataSet')
    # plt.xlabel('x'); plt.ylabel('y')
    plt.title('BestFit')
    plt.xlabel('X1');
    plt.ylabel('Y1')
    plt.show()

#梯度上升算法
def gradAscent(dataMatIn,classLabels):
    dataMatrix = np.mat(dataMatIn)              #转换成numpy的mat
    labelMat = np.mat(classLabels).transpose()  #转换后进行转置
    m,n = np.shape(dataMatrix)                  #返回dataMatrix的大小,m为函数,n为列数
    alpha = 0.001                               #移动步长
    maxCycles = 500                             #最大迭代次数
    weights = np.ones((n,1))
    for k in range(maxCycles):
        h = sigmoid(dataMatrix * weights)
        error = labelMat - h
        weights = weights + alpha * dataMatrix.transpose() * error
    return weights.getA()

def stocGradAscent1(dataMatrix,classLabels,numIter = 150):
    m,n = np.shape(dataMatrix)
    weights = np.ones(n)        #参数初始化
    for j in range(numIter):
        dataIndex = list(range(m))
        for i in range(m):
            alpha = 4/(1.0+j+i)+0.01                                #降低alpha的大小
            randIndex = int(random.uniform(0,len(dataIndex)))       #随机抽取样本
            h = sigmoid(sum(dataMatrix[dataIndex[randIndex]]*weights))  #计算h
            error = classLabels[dataIndex[randIndex]] - h       #计算误差
            weights = weights+alpha * error * dataMatrix[dataIndex[randIndex]]#更新回归函数
            del(dataIndex[randIndex])           #删除已使用的样本
    return weights

if __name__ =='__main__':

    dataMat,labelMat = loadDataSet()
    weights = stocGradAscent1(np.array(dataMat),labelMat)
    #weights = gradAscent(dataMat,labelMat)
    plotDataSet(weights)
3. 示例:从疝气病症预测病马的死亡率
使用Logistic回归方法进行分类不需要做很多工作,只要把测试集上每个特征向量乘以最优化方法得来的回归系数,再将该乘机结果求和,最后输入到sigmoid函数中即可,然后进行打标签。以下是书上的demo
代码:
import random
import matplotlib.pyplot as plt
import numpy as np

def sigmoid(inX):
    return 1.0/(1+np.exp(-inX))
def stocGradAscent1(dataMatrix,classLabels,numIter = 150):
    m,n = np.shape(dataMatrix)
    weights = np.ones(n)        #参数初始化
    for j in range(numIter):
        dataIndex = list(range(m))
        for i in range(m):
            alpha = 4/(1.0+j+i)+0.01                                #降低alpha的大小
            randIndex = int(random.uniform(0,len(dataIndex)))       #随机抽取样本
            h = sigmoid(sum(dataMatrix[dataIndex[randIndex]]*weights))  #计算h
            error = classLabels[dataIndex[randIndex]] - h       #计算误差
            weights = weights+alpha * error * dataMatrix[dataIndex[randIndex]]#更新回归函数
            del(dataIndex[randIndex])           #删除已使用的样本
    return weights

def classifyVector(inX,weights):
    prob = sigmoid(sum(inX*weights))
    if prob >0.5:return 1.0
    else:return 0.0
def colicTest():
    frTrain = open('horseColicTraining.txt')
    frTest = open('horseColicTest.txt')
    trainingSet = [];
    trainingLabels = []
    for line in frTrain.readlines():
        currLine = line.strip().split('\t')
        lineArr = []
        for i in range(21):
            lineArr.append(float(currLine[i]))
        trainingSet.append(lineArr)
        trainingLabels.append(lineArr)
    trainWeights = stocGradAscent1(np.array(trainingSet),trainingLabels,1000)
    errorCount = 0;numTestVec = 0.0
    for line in frTest.readlines():
        numTestVec +=1.0
        currLine = line.strip().split('\t')
        lineArr = []
        for i in range(21):
            lineArr.append(float(currLine[i]))
        if int(classifyVector(np.array(lineArr),trainWeights))!= int(currLine[21]):
            errorCount +=1
    errorRata = (float(errorCount)/numTestVec)
    print("the error rate of this test is:%f" % errorRata)
    return errorRata
通过调整colicTest()中的迭代次数和stochGradAscent()中的步长,可以降低评价错误率。
4.课外例子
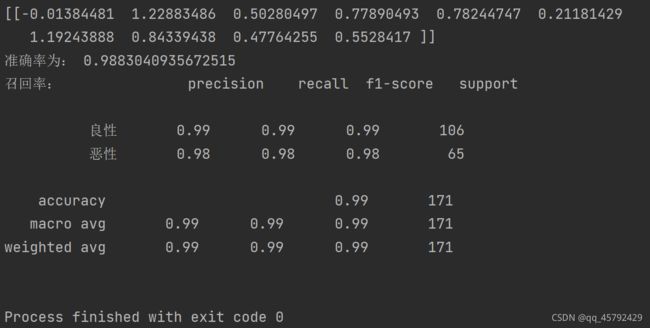
使用logistic预测癌症分类,数据集为乳腺癌分类
属性信息: 1.样本代码编号:id编号 2.团块厚度:1-10 3.细胞大小的均匀性:1-10 4.细胞形状的均匀性:1-10 5.边缘附着力:1-10 6.单层上皮细胞大小:1-10 7.裸核:1-10 8.乏味染色质:1-10 9.正常核仁:1-10 10.线粒体:1-10 11.类别:(良性2,恶性4) 。
代码:
import numpy as np
import pandas as pd
from sklearn.model_selection import train_test_split
from sklearn.preprocessing import StandardScaler
from sklearn.linear_model import LogisticRegression
from sklearn.metrics import classification_report

def logistic():
    names = ['Sample code number','Clump Thickness','Uniformity of Cell Size','Unifromity of Cell Shape',
             'Marginal Adhesion','Single Epithelial Cell Size','Bare Nuclei','Bland Chromatin',
             'Normal Nucleoli','Mitoses','Class']
    data = pd.read_csv('breast-cancer-wisconsin.data',names = names)

    data = data.replace(to_replace='?',value=np.nan)
    data = data.dropna()

    # 进行数据的分割
    x_train, x_test, y_train, y_test = train_test_split(data.loc[:, 'Sample code number':'Mitoses'],
                                                        data.loc[:, 'Class'], test_size=0.25)

    # 特征值的标准化
    std = StandardScaler()
    x_train = std.fit_transform(x_train)
    x_test = std.transform(x_test)

    # 使用逻辑回归进行预测
    lr = LogisticRegression(C=1.0)
    lr.fit(x_train, y_train)
    print(lr.coef_)
    y_predict = lr.predict(x_test)

    # 输出准确率
    print("准确率为:", lr.score(x_test, y_test))

    # 输出召回率
    print("召回率:", classification_report(y_test, y_predict, labels=[2, 4], target_names=["良性", "恶性"]))
    # print(x_train)

    return None

if __name__ =="__main__":
    logistic()
鸣谢:1
5. 总结
Logistic回归的目的是寻找一个非线性函数Sigmoid的最佳拟合参数,求解过程可以有最优化算法来完成。在最优化算法中,最常用的是梯度上升算法,而此算法又可以简化成随机梯度上升算法。
随机梯度上升算法是一个在线算法,可以在新数据到来时完成参数更新,而不是像梯度上升算法那样对整个数据集进行批处理。
