Working with large lists in MOSS2007(三)
Test harness
All of the tests were executed through one of three different test harnesses. Each one is described in more detail below.
所有这些测试都是通过下面这三个不同的测试用具之一进行的。下面对每一个进行详细描述。
WinForm test application
The WinForm test application was used for the majority of the tests. It was written in the Microsoft Visual Basic.NET development system, and runs on the Office SharePoint Server 2007 computer itself so that it can use the OM to retrieve data from Office SharePoint Server 2007. It used the new StopWatch feature of the Microsoft.NET Framework version 2.0 to capture the elapsed milliseconds that each test took to complete both retrieving the data and enumerating the results. The test results were enumerated and the values of two fields of data were retrieved from each item so that if any data access method caused some additional processing time in the retrieval of those items, it would get recorded along with the results. This was done to give a more realistic representation of how the data would be used in a real-world scenario.
WinForm测试应用程序是测试中主要使用的。使用VB.NET开发,运行在MOSS2007上,以便能使用OM从MOSS2007中检索数据。利用.Net Framework2.0的新特征StopWatch获取在每个测试中完成数据检索和列举出结果集所消耗的毫秒数。从每个列表项中检索两个域/字段的数据并将测试结果被列举出来。这样,任何数据访问方法在检索那些列表项时所引起的某些额外处理时间都将被一同记录下来。这将更能实际的代表数据在真实世界场景中使用情况。
WebPart and JavaScript
Monitoring the time it takes for the predefined Office SharePoint Server 2007 browser interface to render a page was more difficult. In order to capture that information a custom ASP.NET server control was developed. In the OnInit event for the Web Part, the current time down to the millisecond is recorded. When Render is called, that time is output along with some JavaScript onto the page. The JavaScript forces a call when the browser document’s ReadyStateChange event fires to a function that the Web Part creates. That function checks the document’s readyState property and if it is Complete, the function gets the current time, subtracts the time that was captured during the Web Part’s OnInit event, and displays the difference. The value that is displayed represents how long it took from when the Web Part was first initialized until the page was completely finished loading.
监视使用预定义的MOSS2007浏览器接口呈现一个页面所使用的时间更加困难。为了获取这个信息,专门开了一个ASP.NET服务器控件。在Web Part的OnInit事件中,把当前时间精确到毫秒记录下来。当Render被调用时,这个时间被一起通过JavaScript输出到页面上。当浏览器document对象的ReadyStateChange事件被创建Web Part的函数触发时,JavaScript强制调用一个函数。该函数检查document的readyState属性,假如该属性为真,那么函数就显示时间差。这个值代表了从Web Part第一次被初始化到页面完全被加载的时间。
Web Part
A second Web Part was written to use the PortalSiteMapProvider application programming interface (API). This Web Part requires a valid HTTP context and so it would not work in the WinForms test harness. The process it used was very similar to the WinForms application, however — in the Render method it calls the GetCachedListItemsByQuery on the PortalSiteMapProvider class instance and uses the StopWatch class to track the elapsed milliseconds, which it outputs to the page.
另外一个Web Part是使用PortalSiteMapProvider应用程序编程接口(API)编写。这个Web Part要求一个有效的HTTP上下文环境,因此不能在WinForms测试用具中使用。它的过程和WinForms应用程序非常接近。差别在于在Render方法中是调用PortalSiteMapProvider类实例的GetCachedListItemsByQuery方法并使用StopWatch类跟踪输出到页面的时间。
Test results
Before reviewing each of the data points in the testing process it’s also important to understand what each data point represents. Each point on the graph is represents the average of a number of tests. For example, most of the test results consist of five data points. Each data point represents the average time for five tests, so all five data points are the result of 25 tests. The only exception is the tests for the browser-based rendering times — they used a smaller dataset than the other tests. The following sections describe the individual test results. All timed results are measured in milliseconds, so smaller numbers are better.
在回顾测试过程中的数据点之前,理解每个数据点代表的意义也非常重要。图上的每个点代表数个测试结果的平均值。举例来说,大多数测试结果由5个数据点组成,每个数据点又代表了5个测试的平均时间。因此,所有的5个数据点实际时25个测试的结果。唯一差别的是基于浏览器的输出时间的测试,他们使用的数据集比其它测试小。接下来的章节将描述每个独立的测试结果。为了更精确,所有的时间结果都是用毫秒来度量。
Browser-based viewing and page size
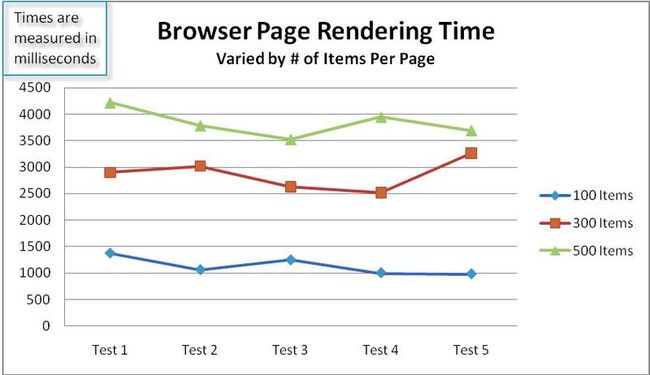
One test that was done was to determine how the number of records displayed for a list on the page impacts the performance of rendering that page. The goal was to understand if showing more items on page caused linear growth, or response times that got exponentially worse. The testing was done against a list with 1,500 items and varied the number of items displayed on a page to be 100, 300 and 500. As shown in the following graph, increasing the number of items displayed per page results in a fairly linear increase in display time.
为了确定显示多少列表中的记录数到页面上是如何影响呈现页面的性能做了这么一个测试。目标是理解显示更多的记录数到页面上将导致一个线性增长,或者说响应时间以指数形式的方式变得更糟糕。测试在一个有1500条数据的列表上做的,每页显示的列表项数分别是100、300和500。正如下图显示的那样,随着每页显示的列表项数量的增加,显示时间也呈线性增长。
译者注:这个测试与前面的测试方法无关,只是为了说明页面展示数量与展示时间的关系。
The baseline test
The goal for the next set of tests was to establish our baseline numbers. Here are the results of the different data access methods against a list with 1,500 items. Only the most common data access methods were included in the baseline testing, so test results for the PortalSiteMapProvider class were not included.
这个测试结果目标是为了建立我们的基线数据。是在一个有1500条列表项的列表上使用不同的数据访问方式测试产生的结果。在基线测试中,只包括最通用的数据访问方法。因此,使用PortalSiteMapProvider类是没有的。
What stands out clearly in this set of results is that viewing the data using the predefined Office SharePoint Server 2007 browser interface is the slowest data access method by far. This is one of the reasons why guidance has been delivered to restrict list sizes to no more than 2,000 items per container. It’s also why we recommend that you don’t consider going above the 2,000 items per container unless you are developing an alternative interface to work with the data.
在这套结果集中清晰地显示出,使用预定义的MOSS2007浏览器接口展示姝姐是所有方法中最慢的。这就是在已经发布的指导手册中将每个容器包含的条目数限制在2,000条内的一个原因。这也是我们建议不考虑在每个容器中包含超过2000条条目的原因,除非你自己开发使用数据的接口。
Testing with a very large list
The next test really shows well what happens when you dramatically increase the number of items in the list over the recommended guideline. In this case, the list contained 100,000 items. The list did not have the index on the Expense Category column, and the site was under load.
接下来这个测试结果很好的显示了当戏剧性地增加列表中的数量并超出建议时到底发生了什么。本例中,列表包含了10万条列表项,列表的Expense Category列也没有索引,站点使用页面加载方式。
The following version of the previous chart omits the two slowest data retrieval methods for ease of comparison between the other methods.
为了更方便的比较其它方法,下面的图去掉了上一个图中数据检索最慢的两个方法。
Using the For/Each enumeration to find items within the list is clearly not a good choice for working with large amounts of data. In addition, there was tremendous overhead in loading all of the list data into an ADO.NET DataTable and then using its filtering capabilities to find the desired data. However, as stated earlier, if you cached the DataTable instead of loading the list data into it on each request, the results would probably have been significantly different. There still would be a very significant hit the first time the list data is loaded into the DataTable, however.
使用For/Each列举在一个包含大量数据的列表中找需要的列表项很明显不是一个好的选择。此外,将所有的列表数据装进ADO.NET的DataTable中然后使用筛选功能来查找也是灾难性的。然而,正如之前说过的那样,假如你不是在每个请求之前加载列表数据到DataTable中,而是缓存DataTable,那么结果很可能明显不同。当然,第一次加载数据到DataTable也非常花费时间。
Another point to note here is just how well the PortalSiteMapProvider class performed. It was lightning fast in these tests, and significantly outperformed the other data access methods. Because the PortalSiteMapProvider and other tested methods performed substantially better than the For/Each, SPList with DataTable and Page Load in Browser methods, the latter methods were not included in any subsequent test results.
这里另一点值得注意的就是PortalSiteMapProvider工作得非常好。在这些测试中,它明显不同,比其它数据访问方法执行情况好得多。由于PortalSiteMapProvider和其它测试方法执行得比For/Each、SPList with DataTable 和 Page Load in Browser方法好得多,因此在后面得测试结果中将不再包含这些方法。
Also, for the Page Load in Browser test, the page was configured to display 100 items per page.
同样,在Page Load in Browser测试中,每页被配置成显示100条列表项。
Comparing results with an indexed column
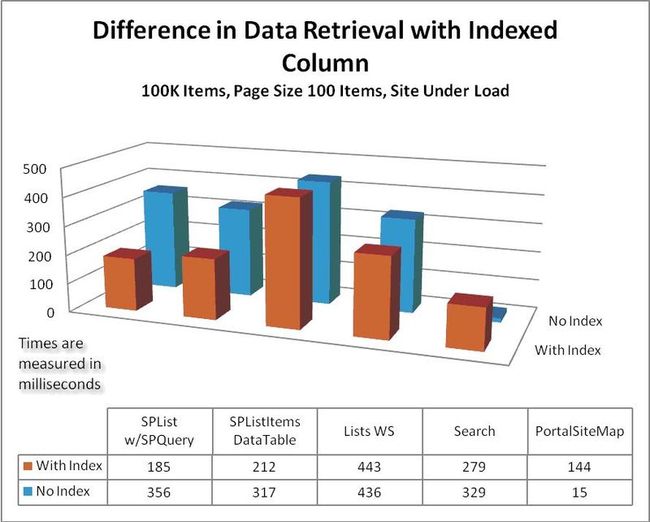
The goal of this test was to determine how much of a performance gain is realized when configuring the column used in the WHERE clause for the test query to be indexed.
这个测试的目标时确定在查询中WHERE条件使用的列被配置被索引到底能获得多少性能的提升。
These results demonstrate that if you are using the SPList class as part of your data access strategy, you will benefit greatly from indexing the columns used in WHERE clauses. For other data access methods, indexing will likely give you only nominal benefit, if at all. Adding a column index actually reduced performance when using the PortalSiteMapProvider class.
这些结果证明了使用SPList类作为你数据访问策略,那么你将从WHERE条件使用被索引的列中获得极大好处。对于其它数据访问方法,索引带给你的好处可能只是一般意义的了。当你使用PortalSiteMapProvider类时,如果将列索引那么会降低执行效率。
Comparing an indexed column to an ID column
This test was conducted to compare the performance differences when using a WHERE clause in the query that relied on an item’s ID rather than the value of an indexed field.
这个测试是为了对比查询中在WHERE条件中依赖列表项的ID和其它索引列时执行效能的差别。
What’s interesting about these results is that they are essentially the inverse of the previous test. That is, when using ID as the filter field criteria, data access methods that do not use the SPList class perform much better. However, data access methods that rely on the SPList class still work much more quickly when they are using an indexed column rather than item IDs.
关于这些结果,非常有意思的根本是把之前的测试倒了过来。也就是,当使用 ID 作为筛选标准,不使用 SPList 类时的执行效能更佳。然而,当使用其它索引列时,依赖于 SPList 类的方法依然比其它数据访问方法执行得更快。


