python计算机视觉课程实验报告_Python计算机视觉-图像处理基础实例测试
图像处理基础实例环境测试
代码参考:http://yongyuan.name/pcvwithpython/
1.PIL-Python图像库
PIL (Python Imaging Library)图像库提供了很多常用的图像处理及很多有用的图像基本操作。PIL库下载地址
[www.pythonware.com/products/pil/] 。
用pip直接安装PIL,若Python版本不兼容则无法安装:
pip install PIL
后知由于PIL仅支持到Python 2.7,而Pillow支持Python 3.x,是在PIL基础上创建的兼容版本,并提供广泛的文件格式支持,强大的图像处理能力,主要包括图像储存、图像显示、格式转换以及基本的图像处理操作等,于是直接用pip安装Pillow:
pip install Pillow
1.1 读入图片并显示灰度图:
# -*- coding: utf-8 -*-
from PIL import Image
from pylab import *
# 添加中文字体支持
from matplotlib.font_manager import FontProperties
font = FontProperties(fname=r"c:\windows\fonts\SimSun.ttc", size=14)
figure()
pil_im = Image.open('D:\Study\Python_CV\helloworld\\test1.jpg')
gray()
subplot(121)
title(u'原图',fontproperties=font)
axis('off')
imshow(pil_im)
pil_im = Image.open('D:\Study\Python_CV\helloworld\\test1.jpg').convert('L')
subplot(122)
title(u'灰度图',fontproperties=font)
axis('off')
imshow(pil_im)
show()
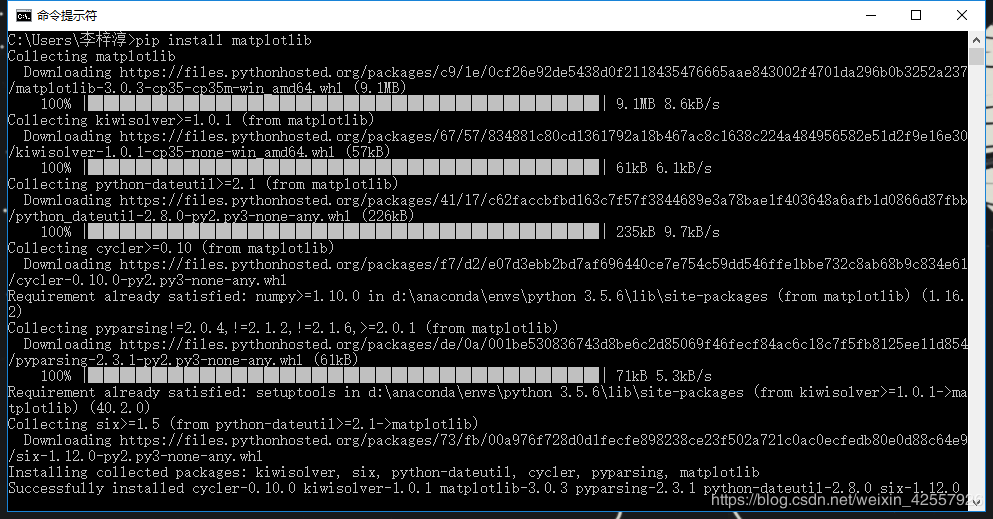
这里用到了Matplotlib这个Python 2D绘图库,也需要安装:
pip install matplotlib
而后能够正常调用库函数显示读取结果:
1.2 调整尺寸及旋转:
要对一幅图像的尺寸进行调整,可以调用resize()方法,元组中放置的便是你要调整尺寸的大小。如果要对图像进行旋转变
换的话,可以调用rotate()方法。
下面代码显示上面提到的所有的图像处理操作,即原图显示、RGB图像转为灰度图像、拷贝粘贴区域、生成缩略图、调整图
像尺寸、图像旋转变换的实例代码:
# -*- coding: utf-8 -*-
from PIL import Image
from pylab import *
# 添加中文字体支持
from matplotlib.font_manager import FontProperties
font = FontProperties(fname=r"c:\windows\fonts\SimSun.ttc", size=14)
figure()
# 显示原图
pil_im = Image.open('D:\Study\Python_CV\helloworld\\test1.jpg')
print(pil_im.mode, pil_im.size, pil_im.format)
subplot(231)
title(u'原图', fontproperties=font)
axis('off')
imshow(pil_im)
# 显示灰度图
pil_im = Image.open('D:\Study\Python_CV\helloworld\\test1.jpg').convert('L')
gray()
subplot(232)
title(u'灰度图', fontproperties=font)
axis('off')
imshow(pil_im)
#拷贝粘贴区域
pil_im = Image.open('D:\Study\Python_CV\helloworld\\test1.jpg')
box = (100, 100, 400, 400)
region = pil_im.crop(box)
region = region.transpose(Image.ROTATE_180)
pil_im.paste(region, box)
subplot(233)
title(u'拷贝粘贴区域', fontproperties=font)
axis('off')
imshow(pil_im)
# 缩略图
pil_im = Image.open('D:\Study\Python_CV\helloworld\\test1.jpg')
size = 128, 128
pil_im.thumbnail(size)
print(pil_im.size)
subplot(234)
title(u'缩略图', fontproperties=font)
axis('off')
imshow(pil_im)
pil_im.save('D:\Study\Python_CV\helloworld\\test2.jpg') #保存缩略图
# 调整图像尺寸
pil_im = Image.open('D:\Study\Python_CV\helloworld\\test2.jpg')
pil_im = pil_im.resize(size)
print(pil_im.size)
subplot(235)
title(u'调整尺寸后的图像', fontproperties=font)
axis('off')
imshow(pil_im)
# 旋转图像45°
pil_im = Image.open('D:\Study\Python_CV\helloworld\\test1.jpg')
pil_im = pil_im.rotate(45)
subplot(236)
title(u'旋转45°后的图像', fontproperties=font)
axis('off')
imshow(pil_im)
show()
处理结果如下:
2.Matplotlib库与NumPy库
之前已经成功安装Matplotlib和NumPy库,当在处理数学及绘图或在图像上描点、画直线、曲线时需要用到Matplotlib,Matplotlib可以在[matplotlib.sourceforge.net] (http://matplotlib.sourceforge.net/)上下载,并且它还提供了详细的文档及教程。
NumPy是Python一个流行的用于科学计算包。它包含了很多诸如矢量、矩阵、图像等其他非常有用的对象和线性代数函数,NumPy可以在scipy.org/Download下载,在线文档(https://docs.scipy.org/doc/numpy/)包含了很多常见问题的答案。
2.1 图像轮廓和直方图
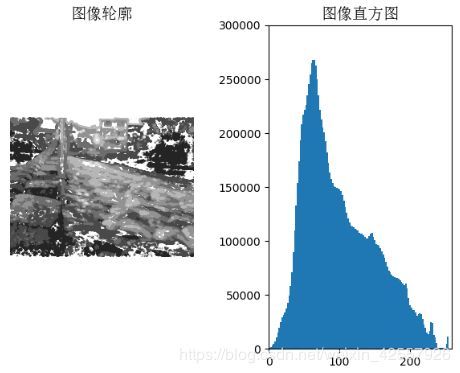
图像轮廓线和图线等高线:在画图像轮廓前需要转换为灰度图像,因为轮廓需要获取每个坐标
[x,y]位置的像素值。下面是画图像轮廓和直方图的代码:
# -*- coding: utf-8 -*-
from PIL import Image
from pylab import *
# 添加中文字体支持
from matplotlib.font_manager import FontProperties
font = FontProperties(fname=r"c:\windows\fonts\SimSun.ttc", size=14)
im = array(Image.open('D:/Study/Python_CV/helloworld/test1.jpg').convert('L')) # 打开图像,并转成灰度图像
figure()
subplot(121)
gray()
contour(im, origin='image')
axis('equal')
axis('off')
title(u'图像轮廓', fontproperties=font)
subplot(122)
hist(im.flatten(), 128)
title(u'图像直方图', fontproperties=font)
plt.xlim([0, 260])
plt.ylim([0, 300000])
show()
处理结果如下:
为使直方图直观形象,应该在xlim()和ylim()函数中适当设置坐标上下限
2.2 直方图均衡化
图像均衡化作为预处理操作,在归一化图像强度时是一个很好的方式,并且通过直方图均衡化可以增加图像对比度。
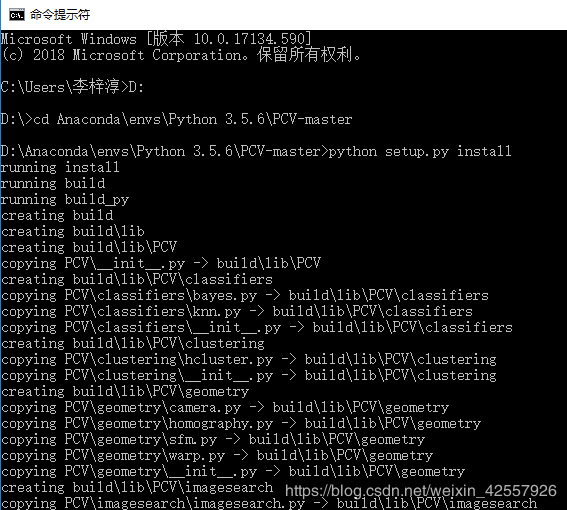
其中用到的第三方库PCV,我在GitHub官网下载安装并成功导入:
下载地址:https://github.com/jesolem/PCV
将PCV库下载并解压到所使用的Python环境中,在命令行中更改路径进入到PCV文件夹,安装指令如下:
python setup.py install
直方图均衡化测试代码:
# -*- coding: utf-8 -*-
from PIL import Image
from pylab import *
from PCV.tools import imtools
# 添加中文字体支持
from matplotlib.font_manager import FontProperties
font = FontProperties(fname=r"c:\windows\fonts\SimSun.ttc", size=14)
im = array(Image.open('D:\Study\Python_CV\helloworld\\test1.jpg').convert('L')) # 打开图像,并转成灰度图像
# im = array(Image.open('../data/AquaTermi_lowcontrast.JPG').convert('L'))
im2, cdf = imtools.histeq(im)
figure()
subplot(2, 2, 1)
axis('off')
gray()
title(u'原始图像', fontproperties=font)
imshow(im)
subplot(2, 2, 2)
axis('off')
title(u'直方图均衡化后的图像', fontproperties=font)
imshow(im2)
subplot(2, 2, 3)
axis('off')
title(u'原始直方图', fontproperties=font)
# hist(im.flatten(), 128, cumulative=True, normed=True)
hist(im.flatten(), 128, normed=True)
subplot(2, 2, 4)
axis('off')
title(u'均衡化后的直方图', fontproperties=font)
# hist(im2.flatten(), 128, cumulative=True, normed=True)
hist(im2.flatten(), 128, normed=True)
show()
均衡化结果如下:
可见处理后结果与原图相比对比度得到增加。
3.SciPy模块
SciPy是一个开源的数学工具包,它是建立在NumPy的基础上的。它提供了很多有效的常规操作,包括数值综合、最优化、统计、信号处理以及图像处理。SciPy库可以再[http://scipy.org/Download] (scipy.org/Download)下载。
通过Anaconda和pip自动安装都因为连接问题失败后我在上述网站直接下载whl文件;
各版本列表网址:https://pypi.org/project/scipy/#files
查找对应自身Python版本的SciPy.whl文件下载到环境文件夹中,在命令行移动到该文件夹用pip执行安装:
3.1 图像模糊
对图像进行高斯模糊,可以用于定义图像尺度、计算兴趣点以及很多其他的应用场合。
# -*- coding: utf-8 -*-
from PIL import Image
from pylab import *
from scipy.ndimage import filters
# 添加中文字体支持
from matplotlib.font_manager import FontProperties
font = FontProperties(fname=r"c:\windows\fonts\SimSun.ttc", size=14)
# im = array(Image.open('board.jpeg'))
im = array(Image.open('D:\Study\Python_CV\helloworld\\test1.jpg').convert('L'))
figure()
gray()
axis('off')
subplot(1, 4, 1)
axis('off')
title(u'原图', fontproperties=font)
imshow(im)
for bi, blur in enumerate([2, 5, 10]):
im2 = zeros(im.shape)
im2 = filters.gaussian_filter(im, blur)
im2 = np.uint8(im2)
imNum=str(blur)
subplot(1, 4, 2 + bi)
axis('off')
title(u'标准差为'+imNum, fontproperties=font)
imshow(im2)
# 如果是彩色图像,则分别对三个通道进行模糊
# for bi, blur in enumerate([2, 5, 10]):
# im2 = zeros(im.shape)
# for i in range(3):
# im2[:, :, i] = filters.gaussian_filter(im[:, :, i], blur)
# im2 = np.uint8(im2)
# subplot(1, 4, 2 + bi)
# axis('off')
# imshow(im2)
show()
处理结果:
3.2 ROF图像降噪
图像降噪是一个在尽可能保持图像细节和结构信息时去除噪声的过程。我们采用Rudin-Osher-Fatemi de-noising(ROF)模型。
# -*- coding: utf-8 -*-
from pylab import *
from numpy import *
from numpy import random
from scipy.ndimage import filters
from scipy.misc import imsave
from PCV.tools import rof
""" This is the de-noising example using ROF in Section 1.5. """
# 添加中文字体支持
from matplotlib.font_manager import FontProperties
font = FontProperties(fname=r"c:\windows\fonts\SimSun.ttc", size=14)
# create synthetic image with noise
im = zeros((500, 500))
im[100:400, 100:400] = 128
im[200:300, 200:300] = 255
im = im + 30*random.standard_normal((500,500))
U, T = rof.denoise(im, im)
G = filters.gaussian_filter(im,10)
# save the result
# imsave('synth_original.pdf',im)
# imsave('synth_rof.pdf',U)
# imsave('synth_gaussian.pdf',G)
# plot
figure()
gray()
subplot(1,3,1)
imshow(im)
# axis('equal')
axis('off')
title(u'原噪声图像', fontproperties=font)
subplot(1,3,2)
imshow(G)
# axis('equal')
axis('off')
title(u'高斯模糊后的图像', fontproperties=font)
subplot(1,3,3)
imshow(U)
# axis('equal')
axis('off')
title(u'ROF降噪后的图像', fontproperties=font)
show()
降噪结果:
结果可见测试成功,降噪效果显著,Python计算机视觉编程相关所需库基本安装完毕。


