数据来源:https://www.kesci.com/mw/project/604db88774dfc60016e29d56/dataset
一、例题1:探索快餐数据
1. 数据预览
| 变量 |
含义 |
| order_id |
订单id |
| quantity |
数量 |
| item_name |
商品名称 |
| choice_description |
详情 |
| item_price |
商品单价 |

2. 代码练习
#导入pandas
import pandas as pd
#读入数据
df = pd.read_csv('/Users/harper/Desktop/python/exercise_data/chipotle.tsv',sep='\t')
#查看前10行内容
df.head(10)
#数据集维度、行数、列数
print(df.shape)#维度:行*列
df.shape[0]#行数
df.shape[1]#行数

<<<<<<<<<<<<<<<<<<<<<<<<<<<<<<
(4622, 5)
4622
5
<<<<<<<<<<<<<<<<<<<<<<<<<<<<<<

#输出列名称,可以比较下面两种形式
print(df.columns)
print(df.columns.to_list())#以列表形式储存

<<<<<<<<<<<<<<<<<<<<<<<<<<<<<<
Index(['order_id', 'quantity', 'item_name', 'choice_description',
       'item_price'],
      dtype='object')

['order_id', 'quantity', 'item_name', 'choice_description', 'item_price']
<<<<<<<<<<<<<<<<<<<<<<<<<<<<<<

#被下单数最多商品(item_name)是什么
#思路:先按item_name分组,再根据quantity求和,再降序排列
#reset_index是可以输出成dataframe
df.groupby('item_name').quantity.sum().reset_index().sort_values(by = 'quantity',ascending = False)

<<<<<<<<<<<<<<<<<<<<<<<<<<<<<<
                                item_name  quantity
17                           Chicken Bowl       761
18                        Chicken Burrito       591
25                    Chips and Guacamole       506
39                          Steak Burrito       386
10                      Canned Soft Drink       351
<<<<<<<<<<<<<<<<<<<<<<<<<<<<<<

#求item_name的类别数
df['item_name'].nunique()

<<<<<<<<<<<<<<<<<<<<<<<<<<<<<<
50
<<<<<<<<<<<<<<<<<<<<<<<<<<<<<<

#在choice_description中下单次数最多的商品是什么
#注意到choice_description 中有一些空值,所以我们先挑出非空的行再分组-求和-排序
df[df['choice_description'].notnull()].groupby('choice_description').quantity.sum().reset_index().sort_values(by = 'quantity',ascending = False)

<<<<<<<<<<<<<<<<<<<<<<<<<<<<<<
                                     choice_description  quantity
15                                          [Diet Coke]       159
14                                               [Coke]       143
583                                            [Sprite]        89
256   [Fresh Tomato Salsa, [Rice, Black Beans, Chees...        49
257   [Fresh Tomato Salsa, [Rice, Black Beans, Chees...        42
<<<<<<<<<<<<<<<<<<<<<<<<<<<<<<

#一共有多少商品被下单,就是计算订单总数
print(df['quantity'].sum())

<<<<<<<<<<<<<<<<<<<<<<<<<<<<<<
4972
<<<<<<<<<<<<<<<<<<<<<<<<<<<<<<

#将item_price转换为浮点数
#注意到item_price前面有$符号
#方法1,个人感觉容易出错,str不知道什么时候需要加
df['item_price'] = df['item_price'].str.replace('$','')
#方法2:apply是针对每个元素,就不需要str了
def func(df):
    df['item_price'] = df['item_price'].replace('$','')
    return df
df = df.apply(func, axis = 1)
df['item_price']  = df['item_price'].astype('float')
print(df['item_price'])

<<<<<<<<<<<<<<<<<<<<<<<<<<<<<<
0        2.39
1        3.39
2        3.39
3        2.39
4       16.98
<<<<<<<<<<<<<<<<<<<<<<<<<<<<<<

#每一单order对应的平均总价是多少,就是计算总收入/总订单数
round((df['quantity']*df['item_price']).sum()/df['order_id'].nunique(),2)

<<<<<<<<<<<<<<<<<<<<<<<<<<<<<<
21.39
<<<<<<<<<<<<<<<<<<<<<<<<<<<<<<
二、例题2:探索欧洲杯数据
1. 数据预览

2. 代码练习
#导入pandas
import pandas as pd
#读入数据
df = pd.read_csv('/Users/harper/Desktop/python/exercise_data/Euro2012_stats.csv')
#计算有多少球队参与了2012欧洲杯,就是计算Team的类别数
df['Team'].nunique()

<<<<<<<<<<<<<<<<<<<<<<
16
<<<<<<<<<<<<<<<<<<<<<<

#该数据集中一共有多少列
print(df.shape[1])

<<<<<<<<<<<<<<<<<<<<<<
35
<<<<<<<<<<<<<<<<<<<<<<

#将数据集中的Team,Yellow Cards和Red Cards单独存为一个叫discipline的数据框,对数据框按照先Red Cards再Yellow Cards进行排序
discipline = df[['Team','Yellow Cards','Red Cards']]
discipline.sort_values(['Red Cards','Yellow Cards'],ascending = False)

<<<<<<<<<<<<<<<<<<<<<<
                   Team  Yellow Cards  Red Cards
6                Greece             9          1
9                Poland             7          1
11  Republic of Ireland             6          1
7                 Italy            16          0
10             Portugal            12          0
13                Spain            11          0
<<<<<<<<<<<<<<<<<<<<<<

#计算每个球队拿到的黄牌数的平均值,就是黄牌数的总数/球队总数
df['Yellow Cards'].sum()/df['Team'].nunique()

<<<<<<<<<<<<<<<<<<<<<<
7.4375
<<<<<<<<<<<<<<<<<<<<<<

#找到进球数Goals超过6的球队数据
df[df['Goals'] > 6])

<<<<<<<<<<<<<<<<<<<<<<
       Team  Goals  Shots on target  ...  Subs on Subs off Players Used
5   Germany     10               32  ...       15       15           17
13    Spain     12               42  ...       17       17           18

<<<<<<<<<<<<<<<<<<<<<<

#选取以字母X开头/结尾/包含的球队数据
df[df['Team'].str.startswith('G')]#开头

<<<<<<<<<<<<<<<<<<<<<<
      Team  Goals  Shots on target  ...  Subs on Subs off Players Used
5  Germany     10               32  ...       15       15           17
6   Greece      5                8  ...       12       12           20
<<<<<<<<<<<<<<<<<<<<<<

df[df['Team'].str.endswith('e')]#结尾

<<<<<<<<<<<<<<<<<<<<<<
       Team  Goals  Shots on target  ...  Subs on Subs off Players Used
4    France      3               22  ...       11       11           19
6    Greece      5                8  ...       12       12           20
15  Ukraine      2                7  ...        9        9           18
<<<<<<<<<<<<<<<<<<<<<<

df[df['Team'].str.contains('a')]#中间

<<<<<<<<<<<<<<<<<<<<<<
                  Team  Goals  ...  Subs off  Players Used
0               Croatia      4  ...         9            16
2               Denmark      4  ...         7            15
3               England      5  ...        11            16
4                France      3  ...        11            19
5               Germany     10  ...        15            17
7                 Italy      6  ...        18            19
8           Netherlands      2  ...         7            15
9                Poland      2  ...         7            17
10             Portugal      6  ...        14            16
11  Republic of Ireland      1  ...        10            17
12               Russia      5  ...         7            16
13                Spain     12  ...        17            18
15              Ukraine      2  ...         9            18
<<<<<<<<<<<<<<<<<<<<<<

#选取前7列
df.iloc[:,0:7]
#选取除了最后3列之外的全部列
df.iloc[:,0:-3]
#找到England,Italy,Russia的射正率(Shooting Accuracy)
df[df['Team'].isin(['England','Italy','Russia'])][['Team','Shooting Accuracy']]

<<<<<<<<<<<<<<<<<<<<<<
       Team Shooting Accuracy
3   England             50.0%
7     Italy             43.0%
12   Russia             22.5%
<<<<<<<<<<<<<<<<<<<<<<
三、例题3:探索酒类数据
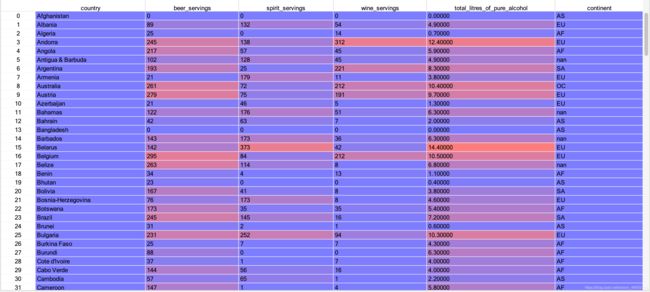
1. 数据预览

2. 代码练习
#导入pandas
import pandas as pf
#导入数据
df = pd.read_csv('/Users/harper/Desktop/python/exercise_data/drinks.csv')
#哪个大陆(continent)平均消耗的啤酒(beer)更多?
#思路:先根据continent分组,再求每个组的均值,再转换成dataframe,再根据均值排序
df.groupby('continent').beer_servings.mean().reset_index().sort_values(by = 'beer_servings',ascending = False).head(1)

<<<<<<<<<<<<<<<<<<<<<
  continent  beer_servings
2        EU     193.777778
<<<<<<<<<<<<<<<<<<<<<

#输出每个大陆(continent)的红酒消耗(wine_servings)的描述性统计值
df.groupby('continent').wine_servings.describe()
#输出每个大陆每种酒类别的消耗平均值
df.groupby('continent').mean()
#输出每个大陆每种酒类别的消耗中位数
df.groupby('continent').median()
#输出每个大陆对spirit饮品消耗的平均值、最大值和最小值
df.groupby('continent').spirit_servings.agg(['mean','max','min'])

<<<<<<<<<<<<<<<<<<<<<
                 mean  max  min
continent
AF          16.339623  152    0
AS          60.840909  326    0
EU         132.555556  373    0
OC          58.437500  254    0
SA         114.750000  302   25
<<<<<<<<<<<<<<<<<<<<<
四、例题4:探索美国犯罪数据
1. 数据预览
2. 代码练习
#导入包
import pandas as pd
#倒入数据
df = pd.read_csv('/Users/harper/Desktop/python/exercise_data/US_Crime_Rates_1960_2014.csv')
#查看每一列的数据类型
df.info()

<<<<<<<<<<<<<<<<<<<<<<<<

RangeIndex: 55 entries, 0 to 54
Data columns (total 12 columns):
 #   Column              Non-Null Count  Dtype
---  ------              --------------  -----
 0   Year                55 non-null     int64
 1   Population          55 non-null     int64
 2   Total               55 non-null     int64
 3   Violent             55 non-null     int64
 4   Property            55 non-null     int64
 5   Murder              55 non-null     int64
 6   Forcible_Rape       55 non-null     int64
 7   Robbery             55 non-null     int64
 8   Aggravated_assault  55 non-null     int64
 9   Burglary            55 non-null     int64
 10  Larceny_Theft       55 non-null     int64
 11  Vehicle_Theft       55 non-null     int64
dtypes: int64(12)
memory usage: 5.3 KB
<<<<<<<<<<<<<<<<<<<<<<<<

#将Year的数据类型转换为datetime64
df['Year'] = pd.to_datetime(df['Year'],format = '%Y')
df['Year']

<<<<<<<<<<<<<<<<<<<<<<<<
0    1960-01-01
1    1961-01-01
2    1962-01-01
3    1963-01-01
4    1964-01-01
5    1965-01-01
6    1966-01-01
7    1967-01-01
8    1968-01-01
9    1969-01-01
10   1970-01-01
11   1971-01-01
<<<<<<<<<<<<<<<<<<<<<<<<

#将Year设置为索引
df = df.set_index('Year',drop = True)
df

<<<<<<<<<<<<<<<<<<<<<<<<
            Population     Total  ...  Larceny_Theft  Vehicle_Theft
Year                              ...
1960-01-01   179323175   3384200  ...        1855400         328200
1961-01-01   182992000   3488000  ...        1913000         336000
1962-01-01   185771000   3752200  ...        2089600         366800
1963-01-01   188483000   4109500  ...        2297800         408300
1964-01-01   191141000   4564600  ...        2514400         472800
1965-01-01   193526000   4739400  ...        2572600         496900
1966-01-01   195576000   5223500  ...        2822000         561200
1967-01-01   197457000   5903400  ...        3111600         659800
<<<<<<<<<<<<<<<<<<<<<<<<

#删除名为Total的列
del df['Total']
#按照Year对数据框进行10年分组并求和
#注意应该是对population求最大值,对其他列求和
df1 = df.resample('10AS').sum()
df1['Population'] = df['Population'].resample('10AS').max()
df1

<<<<<<<<<<<<<<<<<<<<<<<<
            Population   Violent  ...  Larceny_Theft  Vehicle_Theft
Year                              ...
1960-01-01   201385000   4134930  ...       26547700        5292100
1970-01-01   220099000   9607930  ...       53157800        9739900
1980-01-01   248239000  14074328  ...       72040253       11935411
1990-01-01   272690813  17527048  ...       77679366       14624418
2000-01-01   307006550  13968056  ...       67970291       11412834
2010-01-01   318857056   6072017  ...       30401698        3569080

<<<<<<<<<<<<<<<<<<<<<<<<

#何时是美国历史上生存最危险的年代,就是计算各列最大值的索引
df.idxmax()

<<<<<<<<<<<<<<<<<<<<<<<<
Population           2014-01-01
Violent              1992-01-01
Property             1991-01-01
Murder               1991-01-01
Forcible_Rape        1992-01-01
Robbery              1991-01-01
Aggravated_assault   1993-01-01
Burglary             1980-01-01
Larceny_Theft        1991-01-01
Vehicle_Theft        1991-01-01
dtype: datetime64[ns]

Process finished with exit code 0

<<<<<<<<<<<<<<<<<<<<<<<<
五、例题5:自定义数据
#导入pandas
import pandas as pd
#导入数据
raw_data_1 = {
        'subject_id': ['1', '2', '3', '4', '5'],
        'first_name': ['Alex', 'Amy', 'Allen', 'Alice', 'Ayoung'],
        'last_name': ['Anderson', 'Ackerman', 'Ali', 'Aoni', 'Atiches']}

raw_data_2 = {
        'subject_id': ['4', '5', '6', '7', '8'],
        'first_name': ['Billy', 'Brian', 'Bran', 'Bryce', 'Betty'],
        'last_name': ['Bonder', 'Black', 'Balwner', 'Brice', 'Btisan']}

raw_data_3 = {
        'subject_id': ['1', '2', '3', '4', '5', '7', '8', '9', '10', '11'],
        'test_id': ['51', '15', '15', '61', '16', '14', '15', '1', '61', '16']}
#将上述数据框分别命名为data1,data2,data3
data1 = pd.DataFrame(raw_data_1,columns = ['subject_id','first_name','last_name'])
data2 = pd.DataFrame(raw_data_2,columns = ['subject_id','first_name','last_name'])
data3 = pd.DataFrame(raw_data_3,columns = ['subject_id','test_id'])
print(data1)

<<<<<<<<<<<<<<<<<<<<
  subject_id first_name last_name
0          1       Alex  Anderson
1          2        Amy  Ackerman
2          3      Allen       Ali
3          4      Alice      Aoni
4          5     Ayoung   Atiches
<<<<<<<<<<<<<<<<<<<<

print(data2)

<<<<<<<<<<<<<<<<<<<<
  subject_id first_name last_name
0          4      Billy    Bonder
1          5      Brian     Black
2          6       Bran   Balwner
3          7      Bryce     Brice
4          8      Betty    Btisan
<<<<<<<<<<<<<<<<<<<<

print(data3)

<<<<<<<<<<<<<<<<<<<<
  subject_id test_id
0          1      51
1          2      15
2          3      15
3          4      61
4          5      16
5          7      14
6          8      15
7          9       1
8         10      61
9         11      16
<<<<<<<<<<<<<<<<<<<<

#将data1和data2两个数据框按照行的维度进行合并,命名为all_data
all_data = pd.concat([data1,data2])
print(all_data)

<<<<<<<<<<<<<<<<<<<<
  subject_id first_name last_name
0          1       Alex  Anderson
1          2        Amy  Ackerman
2          3      Allen       Ali
3          4      Alice      Aoni
4          5     Ayoung   Atiches
0          4      Billy    Bonder
1          5      Brian     Black
2          6       Bran   Balwner
3          7      Bryce     Brice
4          8      Betty    Btisan
<<<<<<<<<<<<<<<<<<<<

#将data1和data2两个数据框按照列的维度进行合并,命名为all_data_col
all_data_col = pd.concat([data1,data2],axis = 1)
print(all_data_col)

<<<<<<<<<<<<<<<<<<<<
  subject_id first_name last_name subject_id first_name last_name
0          1       Alex  Anderson          4      Billy    Bonder
1          2        Amy  Ackerman          5      Brian     Black
2          3      Allen       Ali          6       Bran   Balwner
3          4      Alice      Aoni          7      Bryce     Brice
4          5     Ayoung   Atiches          8      Betty    Btisan
<<<<<<<<<<<<<<<<<<<<

#按照subject_id对all_data和data3做合并
df1 = pd.merge(all_data,data3,on = 'subject_id', how = 'inner')#内连接
print(df1)

<<<<<<<<<<<<<<<<<<<<
  subject_id first_name last_name test_id
0          1       Alex  Anderson      51
1          2        Amy  Ackerman      15
2          3      Allen       Ali      15
3          4      Alice      Aoni      61
4          4      Billy    Bonder      61
5          5     Ayoung   Atiches      16
6          5      Brian     Black      16
7          7      Bryce     Brice      14
8          8      Betty    Btisan      15
<<<<<<<<<<<<<<<<<<<<

df2 = pd.merge(all_data,data3,on = 'subject_id', how = 'left')#左连接
print(df2)

<<<<<<<<<<<<<<<<<<<<
  subject_id first_name last_name test_id
0          1       Alex  Anderson      51
1          2        Amy  Ackerman      15
2          3      Allen       Ali      15
3          4      Alice      Aoni      61
4          4      Billy    Bonder      61
5          5     Ayoung   Atiches      16
6          5      Brian     Black      16
7          7      Bryce     Brice      14
8          8      Betty    Btisan      15
<<<<<<<<<<<<<<<<<<<<

df3 = pd.merge(all_data,data3,on = 'subject_id', how = 'right')#右连接
print(df3)

<<<<<<<<<<<<<<<<<<<<
   subject_id first_name last_name test_id
0           1       Alex  Anderson      51
1           2        Amy  Ackerman      15
2           3      Allen       Ali      15
3           4      Alice      Aoni      61
4           4      Billy    Bonder      61
5           5     Ayoung   Atiches      16
6           5      Brian     Black      16
7           7      Bryce     Brice      14
8           8      Betty    Btisan      15
9           9        NaN       NaN       1
10         10        NaN       NaN      61
11         11        NaN       NaN      16
<<<<<<<<<<<<<<<<<<<<

df4 = pd.merge(all_data,data3,on = 'subject_id', how = 'outer')#右连接
print(df4)

<<<<<<<<<<<<<<<<<<<<
   subject_id first_name last_name test_id
0           1       Alex  Anderson      51
1           2        Amy  Ackerman      15
2           3      Allen       Ali      15
3           4      Alice      Aoni      61
4           4      Billy    Bonder      61
5           5     Ayoung   Atiches      16
6           5      Brian     Black      16
7           6       Bran   Balwner     NaN
8           7      Bryce     Brice      14
9           8      Betty    Btisan      15
10          9        NaN       NaN       1
11         10        NaN       NaN      61
12         11        NaN       NaN      16
<<<<<<<<<<<<<<<<<<<<
六、例题6:探索风速
1. 数据预览
2. 代码练习
#导入包
import pandas as pd
import datetime
#读入数据,将前三列合并
df = pd.read_table('/Users/harper/Desktop/python/exercise_data/wind.data',sep = '\s+',parse_dates = [[0,1,2]])
print(df.info())#注意时间格式

<<<<<<<<<<<<<<<<<<<<<<<<
 #   Column    Non-Null Count  Dtype
---  ------    --------------  -----
 0   Yr_Mo_Dy  6574 non-null   datetime64[ns]
 1   RPT       6568 non-null   float64
 2   VAL       6571 non-null   float64
 3   ROS       6572 non-null   float64
 4   KIL       6569 non-null   float64
 5   SHA       6572 non-null   float64
 6   BIR       6574 non-null   float64
 7   DUB       6571 non-null   float64
 8   CLA       6572 non-null   float64
 9   MUL       6571 non-null   float64
 10  CLO       6573 non-null   float64
 11  BEL       6574 non-null   float64
 12  MAL       6570 non-null   float64
dtypes: datetime64[ns](1), float64(12)
memory usage: 667.8 KB
<<<<<<<<<<<<<<<<<<<<<<<<

#若不是datetime64,按照以下方式更改
#df['Yr_Mo_Dy'] = pd.to_datetime(df['Yr_Mo_Dy'],format = '%Y%m%d')
#修改列名Yr_Mo_Dy为time
df.rename(columns = {'Yr_Mo_Dy':'time'},inplace = True)
#将time设为索引
df= df.set_index('time',drop = True)
#对应每一个location,一共有多少空值,非空值
print(df.isnull().sum())
print(df.notnull().sum())
#对于全体数据,计算风速的平均值
print(df.mean().mean())
#计算每个location的风速的最小值、最大值、平均值和标准差
print(df.agg(['min','max','mean','std']))

<<<<<<<<<<<<<<<<<<<<<<<<
            RPT        VAL        ROS  ...        CLO        BEL        MAL
min    0.670000   0.210000   1.500000  ...   0.040000   0.130000   0.670000
max   35.800000  33.370000  33.840000  ...  28.210000  42.380000  42.540000
mean  12.362987  10.644314  11.660526  ...   8.707332  13.121007  15.599079
std    5.618413   5.267356   5.008450  ...   4.503954   5.835037   6.699794
<<<<<<<<<<<<<<<<<<<<<<<<

#对于每一个location计算一月份的平均风速
df['date'] = df.index
df['year'] = df['date'].apply(lambda date:date.year)
df['month'] = df['date'].apply(lambda date:date.month)
df['day'] = df['date'].apply(lambda date:date.day)
print(df[df['month'] == 1].mean())
#注意到2061年,这可能是数据错误
def fix(df):
    if df > 1979:
        df = df - 100
    else:
        df = df
    return df
df['year'] = df['year'].apply(fix)
#对于数据记录按照年/月为频率取样
df.query('month == 1 and day == 1')#年
df.query('day == 1')#月
七、例题7:探索泰坦尼克灾难数据
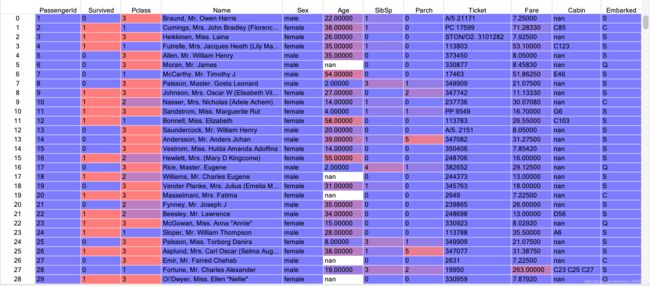
1. 数据预览

2. 代码练习
#导入包
import pandas as pd
import numpy as np
import matplotlib.pyplot as plt
plt.rcParams['font.family'] = 'Arial Unicode MS'#设置中文字体,我的是Mac系统
plt.rcParams['axes.unicode_minus']=False
df = pd.read_csv('/Users/harper/Desktop/python/exercise_data/train.csv')
print(df.columns)
#将PassengerId设置为索引
df = df.set_index('PassengerId',drop = True)
#绘制一个展示男女乘客比例的扇形图
nmale = df['Sex'].value_counts()[0]
nfemale = df['Sex'].value_counts()[1]
sex = [nmale,nfemale]
labels = ['male','female']
plt.pie(sex,labels = labels,autopct = '%0.1f%%')
plt.title('男女乘客比例扇形图')
plt.savefig('/Users/harper/Desktop/1.png',dpi=500,bbox_inches = 'tight')
plt.show()
#绘制一个展示船票Fare与乘客年龄的散点图
plt.scatter(df.Age,df.Fare)
plt.title('船票价格与年龄散点图')
plt.xlabel('年龄')
plt.ylabel('船票价格')
plt.savefig('/Users/harper/Desktop/2.png',dpi=500,bbox_inches = 'tight')
plt.show()
#有多少人生还
#由于Survived是0-1变量,所以对它直接求和就好
df['Survived'].sum()
#绘制一个展示船票价格的直方图
plt.hist(df['Fare'],bins = 20)
plt.title('船票价格直方图')
plt.xlabel('船票价格')
plt.ylabel('频数')
plt.savefig('/Users/harper/Desktop/3.png',dpi=500,bbox_inches = 'tight')
plt.show()
#输出Fare的描述性统计值
df['Fare'].describe()
#乘客姓名以B开头的数据
df[df['Name'].str.startswith('B')].Name
#乘客姓名以y结尾的数据
df[df['Name'].str.endswith('y')].Name
#筛选船票价格超过100男女乘客人数
df[df['Fare'] > 100].Sex.value_counts()
#计算男乘客的平均票价
df[df['Sex'] == 'male']['Fare'].mean()
#将数据先按照Fare降序,再按照Age升序
df1 = df.sort_values(by = ['Fare','Age'],ascending = [False,True])
df1 = df1[['Name','Fare','Age']]
print(df1)
<<<<<<<<<<<<<<<<<<<<<<<<<<<
    PassengerId  Survived  Pclass  ...      Fare        Cabin  Embarked
258          259         1       1  ...  512.3292          NaN         C
737          738         1       1  ...  512.3292         B101         C
679          680         1       1  ...  512.3292  B51 B53 B55         C
27            28         0       1  ...
<<<<<<<<<<<<<<<<<<<<<<<<<<<
八、例题8:探索Apple公司股价数据
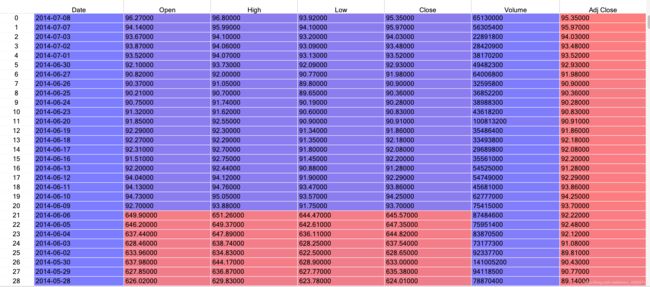
1. 数据预览

2. 代码练习
#导入包
import pandas as pd
import numpy as np
import matplotlib.pyplot as plt
import datetime
plt.rcParams['font.family'] = 'Arial Unicode MS'#设置中文字体
plt.rcParams['axes.unicode_minus']=False
df = pd.read_csv('/Users/harper/Desktop/python/exercise_data/Apple_stock.csv')
#查看每一列的数据类型
print(df.dtypes)

<<<<<<<<<<<<<<<<<<<<<<<
Date         datetime64[ns]
Open                float64
High                float64
Low                 float64
Close               float64
Volume                int64
Adj Close           float64
dtype: object
<<<<<<<<<<<<<<<<<<<<<<<

#将Date这个列转换为datetime格式
df['Date'] = pd.to_datetime(df['Date'],format = '%Y-%m-%d')
print(df.dtypes)
#将Date设置为索引
df = df.set_index('Date')
print(df)
#有重复的日期吗
print(df.index.is_unique)

<<<<<<<<<<<<<<<<<<<<<<<
True
<<<<<<<<<<<<<<<<<<<<<<<

#将index设置为升序
df = df.sort_index(ascending = True)
print(df)
#找到每个月的最后一个交易日
df1 = df.reset_index('Date')
df1['yearmonth'] = df1.Date.apply(lambda x:x.strftime('%Y-%m'))
df1['year'] = df1.Date.apply(lambda x:x.strftime('%Y'))
df1['month'] = df1.Date.apply(lambda x:x.strftime('%m'))
print(df1)

<<<<<<<<<<<<<<<<<<<<<<<
           Date   Open   High    Low  ...  Adj Close  yearmonth  year month
0    1980-12-12  28.75  28.87  28.75  ...       0.45    1980-12  1980    12
1    1980-12-15  27.38  27.38  27.25  ...       0.42    1980-12  1980    12
2    1980-12-16  25.37  25.37  25.25  ...       0.39    1980-12  1980    12
3    1980-12-17  25.87  26.00  25.87  ...       0.40    1980-12  1980    12
4    1980-12-18  26.63  26.75  26.63  ...       0.41    1980-12  1980    12
...         ...    ...    ...    ...  ...        ...        ...   ...   ...
<<<<<<<<<<<<<<<<<<<<<<<

#数据集中最早和最晚的日期相差天数
print(df1['Date'].max()-df1['Date'].min())
#在数据中一共有多少个月
print(df1['yearmonth'].nunique())
#选取2011年1月的数据
print(df1[(df1['year'] == '2011') & (df1['month'] == '01')])
#按照时间顺序可视化Adi Close
plt.plot(df1['Date'],df['Adj Close'])
plt.title('Apple公司Adj Close时序图')
plt.show()
九、例题9:探索Iris纸鸢花数据
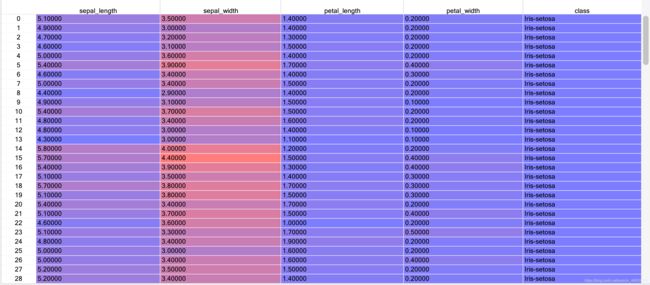
1. 数据预览

2. 代码练习
import pandas as pd
import numpy as np
import matplotlib.pyplot as plt
import datetime
plt.rcParams['font.family'] = 'Arial Unicode MS'
plt.rcParams['axes.unicode_minus']=False
#读入数据并创建数据框的列名称
df = pd.read_csv('/Users/harper/Desktop/python/exercise_data/Iris.csv',
                 names = ['sepal_length','sepal_width', 'petal_length', 'petal_width', 'class'])
#选取前3列数据
df.iloc[:,0:3]
#选取除了最后3列之外的全部数据
df.iloc[:,0:-3]
#数据框中有缺失值吗
df[df.isnull()]
#class这一列一共有多少种类
df['class'].nunique()
#class这一列每个种类有多少数量
df['class'].value_counts()

<<<<<<<<<<<<<<<<<<<<<<<<<<<
Iris-setosa        50
Iris-versicolor    50
Iris-virginica     50
<<<<<<<<<<<<<<<<<<<<<<<<<<<

#将petal_length的第10-18行设置为缺失值
df.iloc[9:18,2:3] = np.nan
df.iloc[9:18,2:3]

<<<<<<<<<<<<<<<<<<<<<<<<<<<
    petal_length
9            NaN
10           NaN
11           NaN
12           NaN
13           NaN
14           NaN
15           NaN
16           NaN
17           NaN
<<<<<<<<<<<<<<<<<<<<<<<<<<<

#将缺失值全部替换为1.0
df['petal_length'].fillna(1.0,inplace = True)
#删除列class
del df['class']
#将数据框前三行设置为缺失值,删除有缺失值的行
df.iloc[0:3,:] = np.nan
df.dropna(inplace = True)

<<<<<<<<<<<<<<<<<<<<<<<<<<<
     sepal_length  sepal_width  petal_length  petal_width
3             4.6          3.1           1.5          0.2
4             5.0          3.6           1.4          0.2
5             5.4          3.9           1.7          0.4
6             4.6          3.4           1.4          0.3
7             5.0          3.4           1.5          0.2
..            ...          ...           ...          ...
<<<<<<<<<<<<<<<<<<<<<<<<<<<

#重新设置索引
df = df.reset_index(drop = True)
print(df)

<<<<<<<<<<<<<<<<<<<<<<<<<<<
     sepal_length  sepal_width  petal_length  petal_width
0             4.6          3.1           1.5          0.2
1             5.0          3.6           1.4          0.2
2             5.4          3.9           1.7          0.4
3             4.6          3.4           1.4          0.3
4             5.0          3.4           1.5          0.2
..            ...          ...           ...          ...
<<<<<<<<<<<<<<<<<<<<<<<<<<<


