缺失数据填补基础方法(3)——Multiple Imputation by Chained Equations (MICE)
目录
-
- 一、MICE方法介绍
- 二、数据集介绍
-
- 2.1 数据集来源
- 2.2 类别属性
- 2.3 下载链接
- 三、代码实现
-
- 3.1 读取数据
- 3.2 检查数据类型
- 3.3 检查相关性
- 3.4 检查缺失值
- 3.5 创建缺失值以便进行填补
- 3.6 Statistical填补
- 3.7 MICE填补
- 3.8 测试填补性能
- 3.9 性能分析
- 四、总结
一、MICE方法介绍
MICE(链式方程多重填补)是一种多重填补,由于其易于实施,并且能够保持无偏效应估计和有效推断,被公认为填补缺失流行病学数据的主要策略。因此,MICE进行多重回归填补。
MICE是一种多重填补方法,其中缺失值被多次填充以创建完整的数据集。MICE是一种填补方法,假设缺失数据是随机缺失的(MAR)。这意味着缺失数据属性与观测数据相关,而与缺失数据无关。因此,填补过程涉及来自其他观测列的信息。MICE算法通过运行多元回归模型工作,每个缺失值根据观察到的(未缺失)值进行有条件的建模。
MICE的主要特征是,它使用链式方程方法进行多重填补。多重填补能够考虑填补中的统计不确定性。链方程方法非常灵活,可以处理各种类型的变量(连续或二进制)以及极限等复杂情况。
MICE步骤如下:
- 步骤1:所有缺失值都初始化为常用的统计方法(例如,mean表示数字,mode表示分类)。这种填补可被视为“占位符”(临时值);
- 步骤2:逐列返回NA。将缺失值最少的变量(“var”)设置回缺少起始值;
- 步骤3:"var"是回归/分类模型中的因变量,所有其他变量是回归模型中的自变量;
- 步骤4:然后用回归模型的预测(填补)替换"var"的缺失值。当"var"随后用作另一变量回归模型中的自变量时,将同时使用该观测值和计算值;
- 步骤5:移动到下一个缺失值最少的变量,然后对每个缺失数据的变量重复步骤2–4。每个变量的循环构成一个迭代或“循环”。在一个周期结束时,所有缺失的值都已替换为反映数据中观察到的关系的回归预测。其想法是,在周期结束时,控制填补的参数分布(如回归模型中的系数)应在稳定的意义上收敛;
基于其性能,MICE建立了填补方法的潜力,该方法能够产生更接近原始值的预测值。然而,检查这些技术的强度对于帮助理解其特性很重要。
二、数据集介绍
2.1 数据集来源
该数据集包括根据墨西哥、秘鲁和哥伦比亚国家的饮食习惯和身体状况估计个人肥胖水平的数据。
Fabio Mendoza Palechor, Email: fmendoza1 ‘@’ cuc.edu.co, Celphone: +573182929611
Alexis de la Hoz Manotas, Email: akdelahoz ‘@’ gmail.com, Celphone: +573017756983
2.2 类别属性
该数据集包括根据墨西哥、秘鲁和哥伦比亚的饮食习惯和身体状况估计个人肥胖水平的数据。数据包含17个属性和2111条记录,这些记录标有类别变量NObesity(肥胖水平),允许使用体重不足、正常体重、超重水平I、超重水平II、肥胖类型I、肥胖类型II和肥胖类型III的值对数据进行分类。77%的数据是使用Weka工具和SMOTE过滤器综合生成的,23%的数据是通过网络平台直接从用户那里收集的。
其17个属性如下:
| 属性 | 描述 | 类型 | 取值 |
|---|---|---|---|
| Gender | 性别 | object | female, male |
| Age | 年龄 | float64 | numeric |
| Height | 身高 | float64 | numeric,in meters |
| Weight | 体重 | float64 | numeric, in kilograms |
| family_history_with_overweight | 家族肥胖史 | object | yes,no |
| FAVC (frequent consumption of high caloric food) | 经常食用高热量食物 | object | yes,no |
| FCVC (frequency of consumption of vegetables) | 食用蔬菜的频率 | object | never,sometimes,always |
| NCP (number of main meals) | 主餐次数 | object | 1, 2, 3 or 4 |
| CAEC (consumption of food between meals) | 两餐之间的食物摄入量 | object | no,sometimes,frequently,always |
| SMOKE | 吸烟 | object | yes,no |
| CH20 (consumption of water) | 消耗水 | object | less than a liter,1–2 liters,more than 2 liters |
| SCC (calorie consumption monitoring) | 卡路里消耗监测 | object | yes,no |
| FAF (physical activity frequency per week) | 每周的体育活动频率 | float64 | 0 = none, 1 = 1 to 2 days, 2= 2 to 4 days, 3 = 4 to 5 days |
| TUE (time using technology devices a day) | 每天使用科技设备的时间 | float64 | 0 = 0–2 hours, 1 = 3–5 hours, 2 = more than 5 hours |
| CALC (consumption of alcohol) | 饮酒 | object | never,sometimes,frequently,always |
| MTRANS | 出行工具 | object | 1automobile,motorbike,bike,public transportation, walking |
| NObeyesdad | 肥胖等级 | object | Insufficient Weight, Normal Weight, Overweight Level I, Overweight Level II, Obesity Type I, Obesity Type II and Obesity Type III |
2.3 下载链接
下载链接如下:https://archive.ics.uci.edu/ml/datasets/Estimation+of+obesity+levels+based+on+eating+habits+and+physical+condition+
三、代码实现
3.1 读取数据
首先导入相应的包,
然后使用pandas读取obesity.csv的数据:
data_full = pd.read_csv('data/obesity.csv')
data_full.head()
3.2 检查数据类型
接下来检查数据类型:
# 数据类型
data_full.dtypes
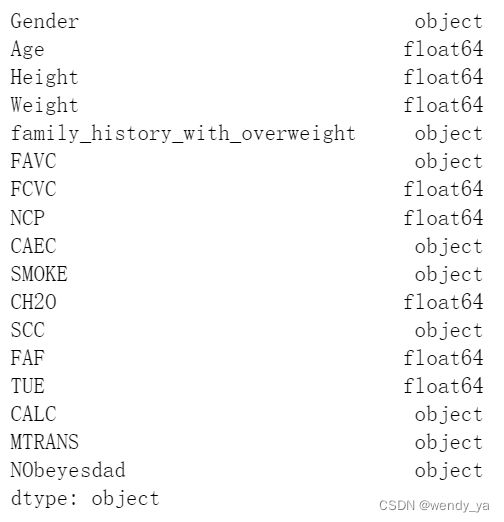
在检查上述数据类型的基础上,发现变量上存在几种不合适的数据类型:
Gender,family_history_with_overweight,FAVC,CAEC,SMOKE,SCC,CALC,MTRANS,NObeyesdad → 应该是category类别
因此需要转换数据类型:
#类型转换
kolom_category = ["Gender", "family_history_with_overweight", "FAVC", "CAEC", "SMOKE", "SCC", "CALC", "MTRANS", "NObeyesdad"]
data_full[kolom_category] = data_full[kolom_category].astype('category')    #转换数据类型为category
data_full.dtypes
数据类型如下:
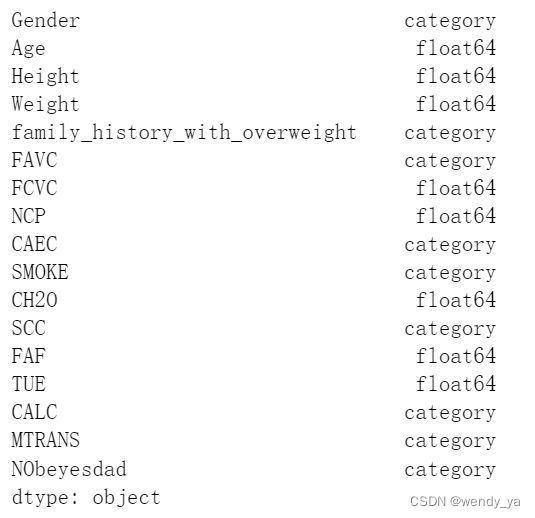
数据类型转换成功,所有数据类型都正确。但是,在“Category”列中,需要进行特殊处理,即编码标签。这种方法将列中的每个值转换为一个数字。需要这样做,因为MICE填补技术要求所有输入和输出变量都是数字,代码如下:
data_full['Gender'] = data_full['Gender'].cat.codes
data_full['family_history_with_overweight'] = data_full['family_history_with_overweight'].cat.codes
data_full['FAVC'] = data_full['FAVC'].cat.codes
data_full['CAEC'] = data_full['CAEC'].cat.codes
data_full['SMOKE'] = data_full['SMOKE'].cat.codes
data_full['SCC'] = data_full['SCC'].cat.codes
data_full['CALC'] = data_full['CALC'].cat.codes
data_full['MTRANS'] = data_full['MTRANS'].cat.codes
data_full['NObeyesdad'] = data_full['NObeyesdad'].cat.codes
可以看出,在对标签进行编码之前,Gender列中的唯一值为Female和Male。但是,在使用进行编码.cat.codes之后,唯一值变为0和1。这表示编码过程已成功执行。
3.3 检查相关性
接下来检查相关性。对相关值进行检查,以查看列之间的关系有多强。回答一列是否可以用另一列中的值来解释。**相关分析采用皮尔逊法。**相关系数是两个变量相对运动之间关系强度的统计度量。值的范围介于-1.0和1.0之间。相关系数-1.0表示完全负相关,而相关系数1.0表示完全正相关。0.0的相关性表明两个变量的移动之间没有线性关系。
#检查相关性
#相关矩阵
data_full.corr()

#Correlation heatmap
plt.figure(figsize=(15,10))
sns.heatmap(data_full.corr(), annot = True)
运行结果如下:
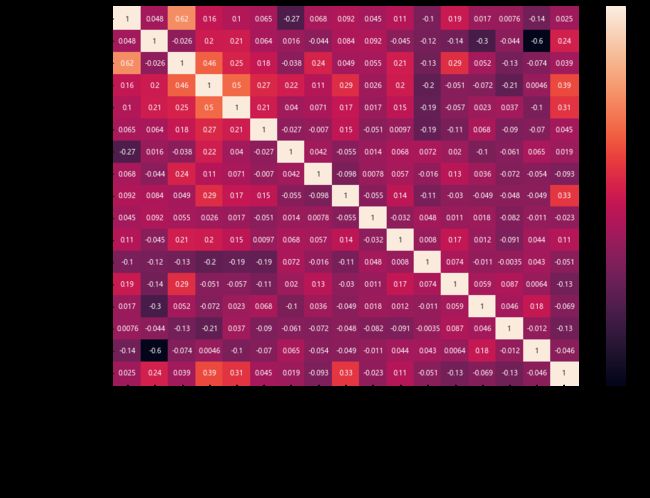
根据结果,通常没有直接具有强关系的列。有几个列,如身高与性别、家族史与超重与体重、MTRANS与年龄之间的相关性大于0.5,因此表明两者之间存在关系,但不太强。
3.4 检查缺失值
在数据预处理之前,对原始数据集执行缺失值检查:
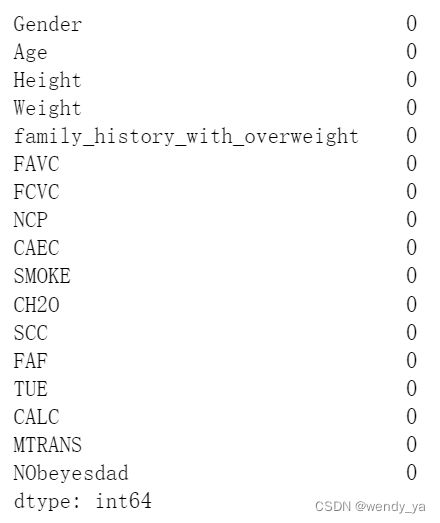
data_full.isnull().sum().sum()
0
说明数据集中没有缺失值。
3.5 创建缺失值以便进行填补
在age、height和family_history_with_overweight列中手动创建缺失值。
首先,创建一个名为data_mv的新DataFrame,它是data_full的副本。然后随机生成30%的NaN。以下列中创建缺失值:age (column 1), height (column 2), and family_history_with_overweight (column 4):
在创建缺失值之前,由于family_history_with_overweight为category转换后的int类型,而int类型无法转换为nan,因此需要将其先转为float类型:
data_mv = data_full.copy()#拷贝
#转为float类型
data_mv['family_history_with_overweight']=data_mv['family_history_with_overweight'].astype(float)  #转为float类型
data_mv['family_history_with_overweight']
# 创建缺失值
random.seed(123)    #设置随机数种子

ix = [(row, col) for row in range(data_mv.shape[0]) for col in range(data_mv.shape[1])]  #2111*17=35887
for row, col in random.sample(ix, int(round(.3*len(ix)))):
    if (col ==  1) | (col == 2) | (col == 4):
        data_mv.iat[row, col] = np.nan
检查缺失值:
data_mv.isnull().sum()
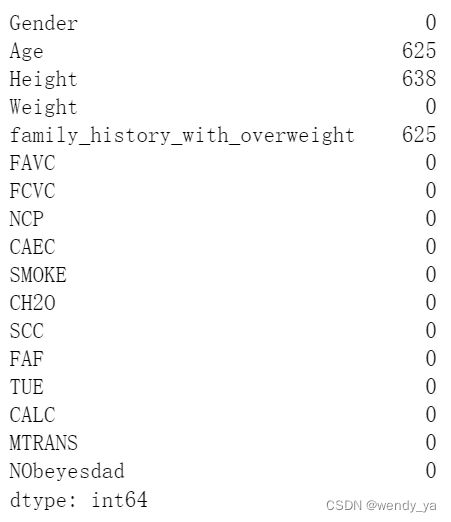
现在,这些列中缺少值:
age→ 625
Height→ 638
family_history_with_overweight→ 625
通过将缺失值的数量除以data_mv的长度,计算缺失值数量的百分比:
data_mv.isnull().sum()/len(data_mv)
本项目将使用Statistical和MICE两种技术进行填补。
3.6 Statistical填补
使用Statistical技术进行填补:
- 数字列中填写平均值 (Age and Height)
- 在分类列中填写众数值(family_history_with_overweight)
# 将数据拷贝到obesity_statistical_imputed
obesity_statistical_imputed = data_mv.copy()

# 用平均值替换NA的age
obesity_statistical_imputed.Age = obesity_statistical_imputed.Age.fillna(obesity_statistical_imputed['Age'].mean())

# 用平均值替换NA的Height
obesity_statistical_imputed.Height = obesity_statistical_imputed.Height.fillna(obesity_statistical_imputed['Height'].mean())

# 用众数值替换NA的family_history_with_overweight
obesity_statistical_imputed['family_history_with_overweight'].fillna(obesity_statistical_imputed['family_history_with_overweight'].mode()[0], inplace=True)
接下来检查填补后的缺失值:
obesity_statistical_imputed.isnull().sum()
3.7 MICE填补
MICE的实现是通过使用fancyimpute库完成的。
在fancyimpute中,MICE算法被命名为IterativeImputer。采用的步骤如下:
- 将data_mv拷贝到besity_mice_imputed;
- 使用名称mice_imputer初始化IterativeImputer;
- 使用fit_transform填补数据;
- 对于分类数据family_history_with_overweight,将填补数据四舍五入;
# 将数据拷贝到 obesity_mice_imputed
obesity_mice_imputed = data_mv.copy()

# 初始化terativeImputer
mice_imputer = IterativeImputer()

# 使用fit_tranform填补数据
obesity_mice_imputed.iloc[:, :] = mice_imputer.fit_transform(obesity_mice_imputed)

# 对categorical数据进行四舍五入
obesity_mice_imputed['family_history_with_overweight'] = (round(obesity_mice_imputed['family_history_with_overweight']))
接下来检查填补后的缺失值:
obesity_mice_imputed.isnull().sum()
3.8 测试填补性能
为了检验填补方法的性能,本项目使用MSE和RMSE值进行数值预测,并使用Accuracy进行类别预测。
均方误差(MSE)和均方根误差(RMSE)是用于评估模型的标准统计指标。
- 均方误差(MSE)是实际值和预测值之间的平均平方误差;
- 均方根误差(RMSE)是预测误差率的大小;
MSE 公式:
M S E = 1 n ∑ i = 1 n ( y i − y i ^ ) 2 MSE = \frac {1}{n} \sum^{n}_{i=1} (y_i - \hat{y_i})^2 MSE=n1i=1∑n(yi−yi^)2
RMSE 公式:
R M S E = ∑ i = 1 n ( y i − y i ^ ) 2 n RMSE = \sqrt {\sum^{n}_{i=1} \frac {(y_i - \hat{y_i})^2} {n}} RMSE=i=1∑nn(yi−yi^)2
- M S E MSE MSE = mean square error
- R M S E RMSE RMSE = root mean square error
- y y y = observed value
- y i ^ \hat{y_i} yi^= predicted result value
- i i i = order of data in database
- n n n = number of data
MSE和RMSE值越小,接近0,表明预测结果更准确。
参考:https://gmd.copernicus.org/articles/7/1247/2014/
Accuracy是一种指标,将分类或预测模型的性能总结为正确预测数除以预测总数。基于准确度的测量更合适,通常用于评估分类数据的预测或填补。精度为1表示完全准确,而精度为0表示随机猜测。
首先测试Statistical填补的性能:
测试MSE和RMSE:
mse_height_stats = mean_squared_error(data_full.Height, obesity_statistical_imputed.Height)
print(mse_height_stats)

rmse_height_stats = mean_squared_error(data_full.Height, obesity_statistical_imputed.Height, squared=False)
print(rmse_height_stats)

# Age
mse_age_stats = mean_squared_error(data_full.Age, obesity_statistical_imputed.Age)
print(mse_age_stats)

rmse_age_stats = mean_squared_error(data_full.Age, obesity_statistical_imputed.Age, squared=False)
print(rmse_age_stats)
0.002551179335941087
0.05050920050783903
13.065689619855316
3.61464930800421
测试Accuracy:
accuracy_score(data_full.family_history_with_overweight, obesity_statistical_imputed.family_history_with_overweight)
0.9398389388915206
接下来测试MICE填补的性能:
#Height
mse_height_mice = mean_squared_error(data_full.Height, obesity_mice_imputed.Height)
print(mse_height_mice)

rmse_height_mice = mean_squared_error(data_full.Height, obesity_mice_imputed.Height, squared=False)
print(rmse_height_mice)

# Age
mse_age_mice = mean_squared_error(data_full.Age, obesity_mice_imputed.Age)
print(mse_age_mice)

rmse_age_mice = mean_squared_error(data_full.Age, obesity_mice_imputed.Age, squared=False)
print(rmse_age_mice)
0.0010379559663753419
0.0322173240101555
6.928177454170019
2.6321431294992337
测试Accuracy:
accuracy_score(data_full.family_history_with_overweight, obesity_mice_imputed.family_history_with_overweight)
0.9578398863098058
3.9 性能分析
在计算MSE、RMSE和Accuracy以评估每种填补方法(Statistical和MICE)的预测性能后,得出以下结果:
| Height | Age | Family History | |||
| MSE | RMSE | MSE | RMSE | Accuracy | |
| 0.002 | 0.05 | 13.07 | 3.61 | 0.94 | |
| Height | Age | Family History | |||
| MSE | RMSE | MSE | RMSE | Accuracy | |
| 0.001 | 0.03 | 6.93 | 2.63 | 0.96 | |
上述结果表明,与Statistical统计填补方法相比,用MICE填补可以产生较低的MSE和RMSE值。众所周知,MSE和RMSE值越低,填补值越接近实际值。然后计算Family History的准确度值也显示出较好的准确度得分,达到96%。
MICE成功地填补了所有类型的列,即数字列(Height、Age)和分类列(Family History)。
四、总结
使用fancyimpute库成功地对缺失的随机数据进行了MICE缺失数据插补。
结果表明,在数值数据的MSE和RMSE以及分类数据的准确性 Accuracy方面,MICE的表现优于统计填补Statistical。MICE使用其他列中的信息的想法证明有助于替换缺失的值。
MICE能够很好地处理数字和分类数据类型。我们相信,当每一列的相关性较大时,MICE将产生更优秀的填补。
以上便是本文的全部内容了,如果没有看懂的话,完整代码可以参考:https://download.csdn.net/download/didi_ya/85581159
参考:
- https://archive.ics.uci.edu/ml/datasets/Estimation+of+obesity+levels+based+on+eating+habits+and+physical+condition+
- https://scikit-learn.org/stable/auto_examples/impute/plot_iterative_imputer_variants_comparison.html


