大数据(线性/非线性)降维方法(PCA,LDA,MDS,ISOMAP,LLE)
文章目录
- 数据块划分
-
- 特征分布
- 特征提取
-
- PCA
- LDA
- MDS
- Isomap
- LLE
数据块划分
对于给定的数据集Magic(19020个样本,10个属性),我们首先将其划分为RSP数据块,然后再分别对他们进行特征提取,比较它们的特征提取结果的概率分布的相似情况
不懂RSP数据块的可以看我的这篇
我们首先先将数据划分为K个HDFS数据块(K=20)
HDFS: [块数:
20块内元素个数:950数据块维度:11]
import os
import pandas as pd
import numpy as np
import seaborn as sns
import matplotlib.pyplot as plt
import warnings
warnings.filterwarnings('ignore')

# 导入数据
data=np.loadtxt('../Magic.txt')
data=data[:19000,:]# 修整一下数据
X=data[:,:-1]
y=data[:,-1]
print('y: ',set(y))
'''
先按HDFS数据块划分,再划分为RSP数据块
'''
K=20 # HDFS数据块个数
M=25 # RSP数据块个数
# 按顺序切分为k份
HDFS=np.array(np.split(data,K))
for i in range(HDFS.shape[0]):
    np.random.shuffle(HDFS[i])
HDFS_list=[np.split(D_k,M) for D_k in HDFS]
print('HDFS: [块数: {0} 块内元素个数: {1} 数据块维度: {2}]'.format(
    HDFS.shape[0],HDFS.shape[1],HDFS.shape[2]))
然后,再根据HDFS数据块划分为RSP数据块
RSP: [块数:
25块内元素个数:760数据块维度:11]
# 划分RSP
RSP=[[D_K[m] for D_K in HDFS_list] for m in range(M)]
for idx,RSP_ in enumerate(RSP):
    tmp_RSP=RSP_[0]
    for i in range(1,len(RSP_)):
        tmp_RSP=np.vstack((tmp_RSP,RSP_[i]))
    RSP[idx]=tmp_RSP
RSP=np.array(RSP)
print('RSP: [块数: {0} 块内元素个数: {1} 数据块维度: {2}]'.format(
    RSP.shape[0],RSP.shape[1],RSP.shape[2]))
特征分布
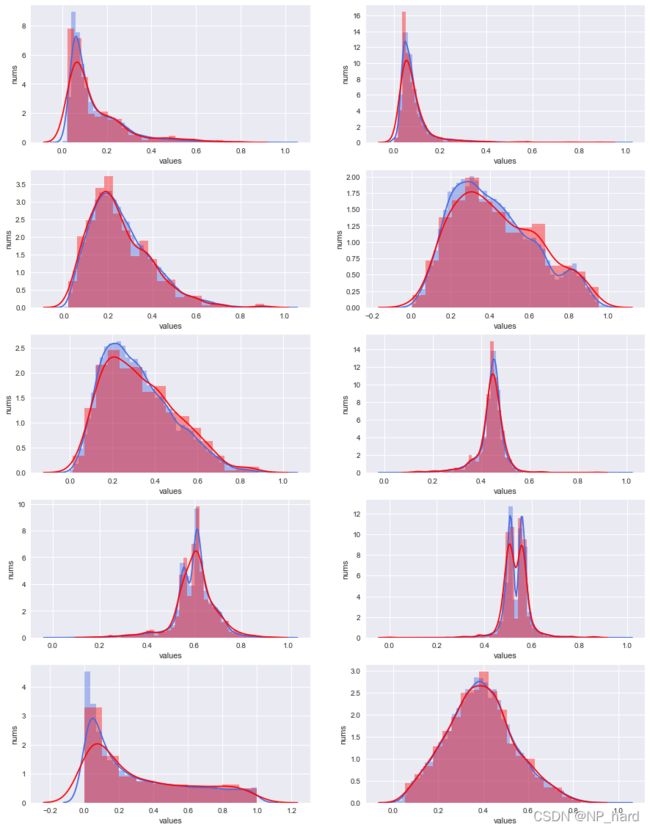
我们对数据整体和RSP数据子块的10个特征进行分布可视化
整体
plt.style.use('seaborn')

fig, axes = plt.subplots(ncols=2, nrows=5,figsize=[15,20])
for i, ax in zip(range(10), axes.flat):
    # ax.set_title('fea'+str(i))
    ax.set_xlabel('values')
    ax.set_ylabel('nums')
    sns.distplot(data[:,i],
        hist=True,kde=True, ax=ax,color='royalblue')
plt.show()

RSP

对比

通过对比整体与RSP的特征分布,我们可以发现两者的分布差异不大
至此,我们便完成了RSP数据块的划分,接下来对数据整体和RSP数据子块进行特征提取
特征提取
PCA
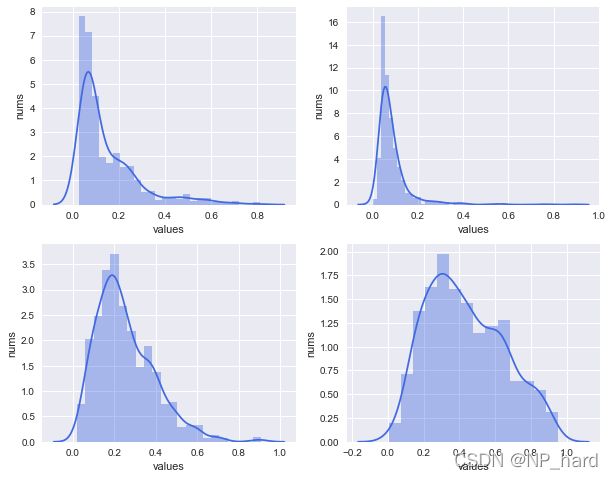
PCA是较为基础的线性降维方法,通过svd得到特征之间协方差矩阵的特征向量,从中选择特征值最大的前k个特征向量作为主成分
我们观察在不同的特征提取个数下,各个主成分的方差占总体的比例(即降维所保留的信息占总体信息量的比例)
'''观察不同维度的方差之和'''
from sklearn.decomposition import PCA

X=data[:,:-1]
pca=PCA( )
pca.fit(X)
ratio=pca.explained_variance_ratio_ # 降维后各成分的方差占比
print("pca.components_: ",pca.components_.shape)
print("pca_var_ratio: ",pca.explained_variance_ratio_.shape)
#绘制图形
plt.plot(range(X.shape[1]),[np.sum(ratio[:i+1]) for i in range(X.shape[1])])
plt.xlabel('nums of component')
plt.ylabel('sum of var ratio')
plt.xticks(np.arange(X.shape[1]))
plt.grid(True)
plt.show()
# 我选择降到4维
n_pca=4
pca=PCA(n_components=n_pca)
X_pca=pca.fit_transform(X)
# 绘图
plt.style.use('seaborn')
fig, axes = plt.subplots(ncols=2, nrows=2,figsize=[10,8])
for i, ax in zip(range(4), axes.flat):
    ax.set_xlabel('values')
    ax.set_ylabel('nums')
    sns.distplot(X[:,i],
        hist=True,kde=True, ax=ax,color='royalblue')
plt.show()
RSP
# 选择某块RSP
tmp_RSP=RSP[0,:,:-1]
tmp_RSP.shape
# 我选择降到4维
n_pca=4
pca_=PCA(n_components=n_pca)
X_pca_=pca.fit_transform(tmp_RSP)
# 绘图
plt.style.use('seaborn')
fig, axes = plt.subplots(ncols=2, nrows=2,figsize=[10,8])
for i, ax in zip(range(4), axes.flat):
    ax.set_xlabel('values')
    ax.set_ylabel('nums')
    sns.distplot(tmp_RSP[:,i],
        hist=True,kde=True, ax=ax,color='royalblue')
plt.show()
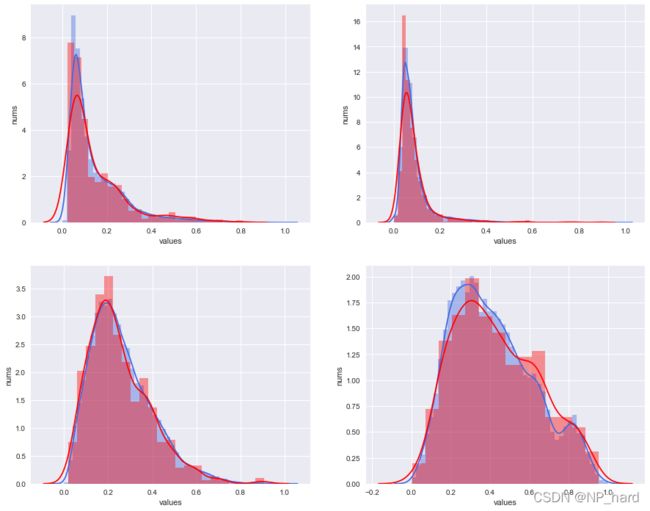
PCA特征提取方法下,整体和RSP的特征分布对比
# 绘图
plt.style.use('seaborn')
fig, axes = plt.subplots(ncols=2, nrows=2,figsize=[15,12])
for i, ax in zip(range(4), axes.flat):
    ax.set_xlabel('values')
    ax.set_ylabel('nums')
    sns.distplot(X[:,i],
        hist=True,kde=True, ax=ax,color='royalblue')
    sns.distplot(tmp_RSP[:,i],
        hist=True,kde=True, ax=ax,color='red')
plt.show()

可以发现PCA的特征提取情况不错,RSP与整体的特征分布大致相同
LDA
LDA是一种线性降维方法,属于监督学习的范畴,通过计算瑞利熵从而进行投影,降维的维数需小于数据的class数
整体
from sklearn.discriminant_analysis import LinearDiscriminantAnalysis
lda = LinearDiscriminantAnalysis(n_components=1)
X=data[:,:-1]
y=data[:,-1]
lda.fit(X,y)
# 绘制特征分布图
X_lda = lda.transform(X)
# 绘图
plt.style.use('seaborn')
plt.figure(figsize=[10,6])
plt.xlabel('values')
plt.ylabel('nums')
sns.distplot(X_lda[:,0],
    hist=True,bins=100,kde=True,color='royalblue')
plt.show()
RSP
# 选择某块RSP
X_lda_RSP=RSP[0,:,:-1]
y_lda_RSP=RSP[0,:,-1]
X_lda_RSP.shape
lda = LinearDiscriminantAnalysis(n_components=1)
lda.fit(X_lda_RSP,y_lda_RSP)

# 绘制特征分布图
X_lda_trans = lda.transform(X_lda_RSP)
# 绘图
plt.style.use('seaborn')
plt.figure(figsize=[10,6])
plt.xlabel('values')
plt.ylabel('nums')
sns.distplot(X_lda_trans[:,0],
    hist=True,bins=100,kde=True,color='royalblue')
plt.show()
LDA特征提取方法下,整体和RSP数据块的分布对比

从上图可以看出,LDA方法在整体和RSP上所提取到的特征分布相似性非常高,这可能是因为LDA是监督学习方法,在提取特征的时候有用到样本的class信息,所提取的特征分布较为良好,但是LDA的局限性在于,可提取的特征数小于类别数,对于本数据集,class={1,2},只有两类,所以只能提取一个特征
MDS
MDS是一种线性降维方法,其核心思想就是保持样本在原空间和低维空间的距离不变
由于MDS的计算需要申请很大的内存空间,对于整体我们很难去进行降维,所以我采取对整体进行20%抽样比的简单随机抽样,理论上抽样得到的数据的特征分布和整体是基本相同的
整体
'''由于整体的isomap降维需要非常大的内存空间,
所以此处采用整体的简单随机抽样以代替整体'''
import random
X=data[:,:-1]
sample_rate=0.2
index=random.sample(list(range(X.shape[0])),int(sample_rate*X.shape[0]))
X_sample_mds=X[index,:]
from sklearn.manifold import MDS
n_MDS=4
MDS=MDS(n_components=n_MDS, max_iter=100, n_init=1)
X_mds_trans=MDS.fit_transform(X_sample_mds)
# 绘制特征分布图
plt.style.use('seaborn')
fig, axes = plt.subplots(ncols=2, nrows=2,figsize=[16,10])
fig.suptitle('0.2 sample rate',size=20)
for i, ax in zip(range(4), axes.flat):
    ax.set_xlabel('values')
    ax.set_ylabel('nums')
    sns.distplot(X_mds_trans[:,i],
        hist=True,kde=True, ax=ax,color='royalblue')
plt.show()
RSP
# 选择某块RSP
tmp_RSP=RSP[0,:,:-1]

n_MDS=4
from sklearn.manifold import MDS
MDS=MDS(n_components=n_MDS, max_iter=100, n_init=1)
X_mds_rsp=MDS.fit_transform(tmp_RSP)
# 绘制特征分布图
plt.style.use('seaborn')
fig, axes = plt.subplots(ncols=2, nrows=2,figsize=[16,10])
for i, ax in zip(range(4), axes.flat):
    ax.set_xlabel('values')
    ax.set_ylabel('nums')
    sns.distplot(X_mds_rsp[:,i],
        hist=True,kde=True, ax=ax,color='royalblue')
plt.show()
MDS特征提取方法下,整体与RSP的特征分布对比
# 绘制特征分布图
plt.style.use('seaborn')
fig, axes = plt.subplots(ncols=2, nrows=2,figsize=[16,10])
for i, ax in zip(range(4), axes.flat):
    ax.set_xlabel('values')
    ax.set_ylabel('nums')
    sns.distplot(X_mds_trans[:,i],
        hist=True,kde=True, ax=ax,color='royalblue')
    sns.distplot(X_mds_rsp[:,i],
        hist=True,kde=True, ax=ax,color='red')
plt.show()
 其中蓝色的为整体抽样的分布,红色的为RSP的分布,从图像上看,两者的特征分布有一定的偏差,这可能是由于抽样比太小,导致整体抽样的分布不能很好的反映整体实际的分布
Isomap
与MDS相同,Isomap的计算需要相当大的内存空间,所以此处采用整体的简单随机抽样以代替整体
整体
from sklearn.manifold import Isomap
n_neighbors=5
n_components=4
Iso=Isomap(n_neighbors=n_neighbors, n_components=n_components)
'''由于整体的isomap降维需要非常大的内存空间,
所以此处采用整体的简单随机抽样以代替整体'''
import random
X=data[:,:-1]
sample_rate=0.7
index=random.sample(list(range(X.shape[0])),int(sample_rate*X.shape[0]))
X_sample_isomap=X[index,:]
from sklearn.manifold import Isomap
n_neighbors=5
n_components=4
Iso=Isomap(n_neighbors=n_neighbors, n_components=n_components)
X_iso_trans=Iso.fit_transform(X_sample_isomap)
# 绘制特征分布图
plt.style.use('seaborn')
fig, axes = plt.subplots(ncols=2, nrows=2,figsize=[16,10])
fig.suptitle('0.7 sample rate',size=20)
for i, ax in zip(range(4), axes.flat):
    ax.set_xlabel('values')
    ax.set_ylabel('nums')
    sns.distplot(X_iso_trans[:,i],
        hist=True,kde=True, ax=ax,color='royalblue')
plt.show()
RSP
# 选择某块RSP
tmp_RSP=RSP[0,:,:-1]
tmp_RSP.shape
n_neighbors = 10
n_components = 4
Iso_RSP=Isomap(n_neighbors=n_neighbors, n_components=n_components)
X_iso_RSP=Iso_RSP.fit_transform(tmp_RSP)
# 绘制特征分布图
plt.style.use('seaborn')
fig, axes = plt.subplots(ncols=2, nrows=2,figsize=[16,10])
for i, ax in zip(range(4), axes.flat):
    ax.set_xlabel('values')
    ax.set_ylabel('nums')
    sns.distplot(X_iso_RSP[:,i],
        hist=True,kde=True, ax=ax,color='royalblue')
plt.show()
Isomap特征提取方法下,整体和RSP的分布对比
# 绘制特征分布图
plt.style.use('seaborn')
fig, axes = plt.subplots(ncols=2, nrows=2,figsize=[16,10])
for i, ax in zip(range(4), axes.flat):
    ax.set_xlabel('values')
    ax.set_ylabel('nums')
    sns.distplot(X_iso_trans[:,i],
        hist=True,kde=True, ax=ax,color='royalblue')
    sns.distplot(X_iso_RSP[:,i],
        hist=True,kde=True, ax=ax,color='red')
plt.show()

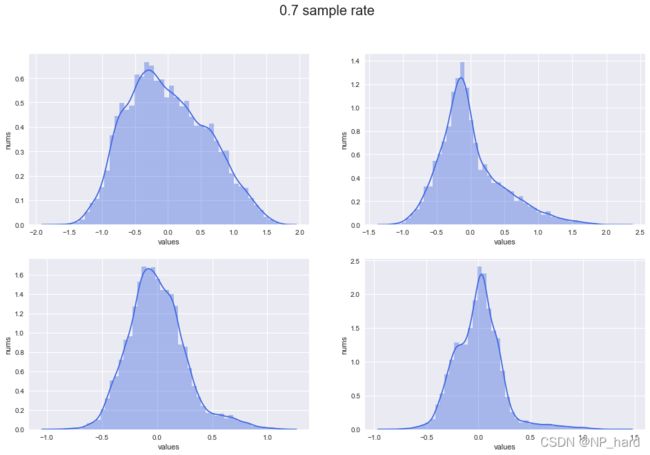
其中红色为RSP数据块的特征分布,蓝色的为整体的特征分布,可以看出RSP数据块的分布较整体的分布而言要更集中,更高,但总体是较为相似的.
Isomap方法本质上属于一种特殊的MDS,不同之处在于Isomap方法用图中两点的最短路径替代了MDS中欧式空间的距离,这样能更好的拟合流形体数据
而在Isomap特征提取方法下的整体和RSP数据块的特征分布不太相似,猜测是因为Magic数据的分布不算是流形,故非线性降维的方法不如线性降维方法,例如PCA和LDA
LLE
LLE是局部线性嵌入的特征提取方式,是一种非线性降维方法
from functools import partial
from sklearn.manifold import LocallyLinearEmbedding
n_neighbors = 10
n_components = 4
# 设置流形学习的方法
LLE = partial(
    LocallyLinearEmbedding,
    n_neighbors=n_neighbors,
    n_components=n_components,
    eigen_solver="auto",
)
整体
X=data[:,:-1]
LLE_standard=LLE(method="standard")
LLE_standard.fit(X)
# 保存模型
import joblib
joblib.dump(LLE_standard, "LLE_standard_4.m")
# 绘制特征分布图
X_LLE_std=LLE_standard.transform(X)
# 绘图
plt.style.use('seaborn')
fig, axes = plt.subplots(ncols=2, nrows=2,figsize=[16,10])
for i, ax in zip(range(4), axes.flat):
    ax.set_xlabel('values')
    ax.set_ylabel('nums')
    ax.set_xlim([-0.05,0.05])
    sns.distplot(X_LLE_std[:,i],
        hist=True,bins=100,kde=True, ax=ax,color='royalblue')
plt.show()
RSP
# 选择某块RSP
tmp_RSP=RSP[0,:,:-1]
tmp_RSP.shape
LLE_std_=LLE(method="standard")
LLE_std_.fit(tmp_RSP)
# 保存模型
import joblib
joblib.dump(LLE_std_, "LLE_standard_RSP_4.m")
# 绘制特征分布图
X_LLE_std_RSP=LLE_standard.transform(tmp_RSP)
# 绘图
plt.style.use('seaborn')
fig, axes = plt.subplots(ncols=2, nrows=2,figsize=[16,10])
for i, ax in zip(range(4), axes.flat):
    ax.set_xlabel('values')
    ax.set_ylabel('nums')
    ax.set_xlim([-0.05,0.05])
    sns.distplot(X_LLE_std_RSP[:,i],
        hist=True,bins=100,kde=True, ax=ax,color='royalblue')
plt.show()
# 绘制特征分布图
X_LLE_std_RSP=LLE_standard.transform(tmp_RSP)
# 绘图
plt.style.use('seaborn')
fig, axes = plt.subplots(ncols=2, nrows=2,figsize=[16,10])
for i, ax in zip(range(4), axes.flat):
    ax.set_xlabel('values')
    ax.set_ylabel('nums')
    ax.set_xlim([-0.05,0.05])
    sns.distplot(X_LLE_std[:,i],
        hist=True,bins=100,kde=True, ax=ax,color='royalblue')
    sns.distplot(X_LLE_std_RSP[:,i],
        hist=True,bins=100,kde=True, ax=ax,color='red')
plt.show()

从整体和RSP的特征分布对比来看,虽然两者之间比较相似,可是可以看出,LLE所提取到的特征分布不是特别均匀,这是由于LLE具有一定的局限性,其要求数据不能是闭合流形,不能是稀疏的数据集,不能是分布不均的数据集等等,局限性较强,不适用于本数据集


