记录一下MATLAB中ode45函数求解非刚性微分方程
首先看一下MATLAB的官方例子
function dydt = vdp1(t,y)
%VDP1  Evaluate the van der Pol ODEs for mu = 1
%
%   See also ODE113, ODE23, ODE45.

%   Jacek Kierzenka and Lawrence F. Shampine
%   Copyright 1984-2014 The MathWorks, Inc.

dydt = [y(2); (1-y(1)^2)*y(2)-y(1)];
主程序:
%%
% Solve the ODE using the |ode45| function on the time interval |[0 20]|
% with initial values |[2 0]|. The resulting output is a column vector of
% time points |t| and a solution array |y|. Each row in |y| corresponds to
% a time returned in the corresponding row of |t|. The first column of |y|
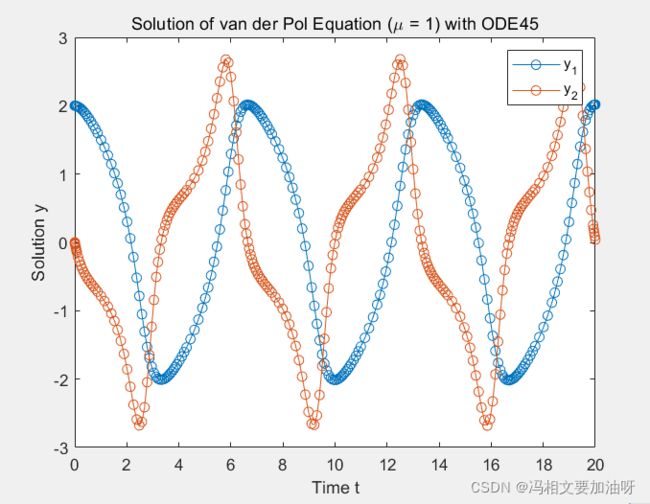
% corresponds to $y_1$, and the second column to $y_2$.
[t,y] = ode45(@vdp1,[0 20],[2; 0]);

%%
% Plot the solutions for $y_1$ and $y_2$ against |t|.
plot(t,y(:,1),'-o',t,y(:,2),'-o')
title('Solution of van der Pol Equation (\mu = 1) with ODE45');
xlabel('Time t');
ylabel('Solution y');
legend('y_1','y_2')
画出来的图像:
对比一下另一个例子:
mycode.m:
function dydt = myode(t,y,ft,f,gt,g)
f = interp1(ft,f,t); % Interpolate the data set (ft,f) at time t
g = interp1(gt,g,t); % Interpolate the data set (gt,g) at time t
dydt = -f.*y + g; % Evaluate ODE at time t
主函数:
ft = linspace(0,5,25);
f = ft.^2 - ft - 3;

gt = linspace(1,6,25);
g = 3*sin(gt-0.25);
tspan = [1 5];
ic = 1;
opts = odeset('RelTol',1e-2,'AbsTol',1e-4);
[t,y] = ode45(@(t,y) myode(t,y,ft,f,gt,g), tspan, ic, opts);
plot(t,y)
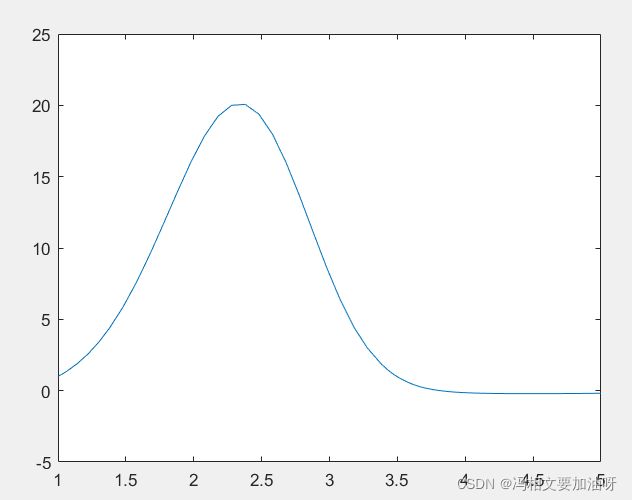
画出来的结果:
总结:
函数主体:[t,y] = ode45(@(t,y) myode(t,y,ft,f,gt,g), tspan, ic, opts);这一句中,myode(t,y,ft,f,gt,g)为需要解的函数,可以自己再修改,就是注意需要把参数对应上,tspan是t的范围,ic其实可以有很多记号表示,也就是上面第一个例子那个[2;0],因为第一个例子有y1,y2两个初值,opts则是一个可选项,有一部分参数在里面调整
后面还有一个关于画完之后继续拓展的,备注一下万一用上
Evaluate and Extend Solution Structure
The van der Pol equation is a second order ODE

Solve the van der Pol equation with  using ode45. The function vdp1.m ships with MATLAB® and encodes the equations. Specify a single output to return a structure containing information about the solution, such as the solver and evaluation points.
tspan = [0 20];
y0 = [2 0];
sol = ode45(@vdp1,tspan,y0)

Use linspace to generate 250 points in the interval [0 20]. Evaluate the solution at these points using deval.
x = linspace(0,20,250);
y = deval(sol,x);

Plot the first component of the solution.
plot(x,y(1,:))

Extend the solution to  using odextend and add the result to the original plot.
sol_new = odextend(sol,@vdp1,35);
x = linspace(20,35,350);
y = deval(sol_new,x);
hold on
plot(x,y(1,:),'r')


