关于天气后报网站的天气数据采集(以北上广深2020年为例)以及数据可视化
一、准备工作
1.观察采集目标网站html结构
①在入口网站可以采集到的每个月的空气质量链接,其中title属性会包含一个月份的标题信息
②观察网页请求的返回信息发现,该网页是静态页面,爬取难度降低
③数据被包含在table标签中
2.搭建Scrapy 环境
①scrapy startproject My_data
②scrapy genspider main xxx
二、采集思路
1.通过入口网站,利用CSS选择器以“title*=“2020””为筛选条件采集到2020每个月份的空气质量网页链接
2.获取整个表格的数据,保存为列表
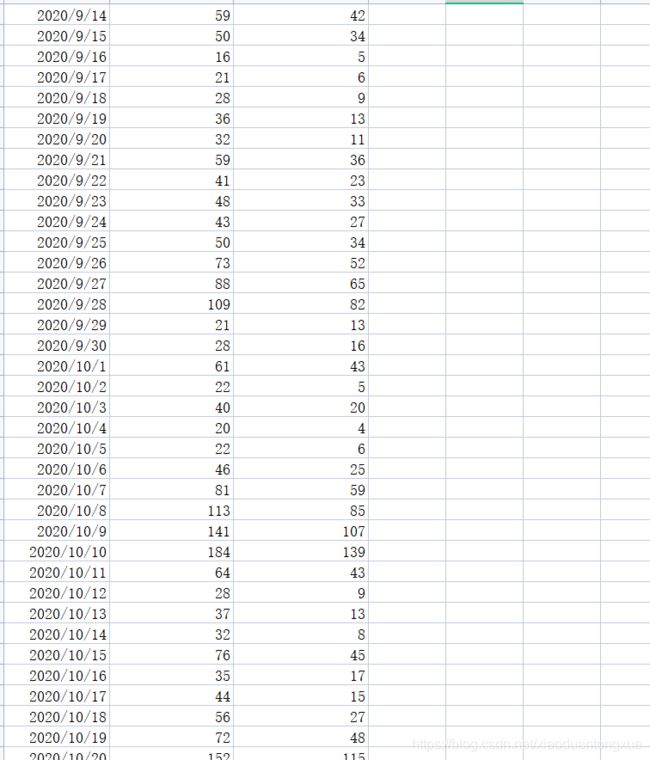
3.在列表的基础上通过步长以及起始点的改变,得到需要的包含在每行中的数据,‘date’,‘aqi’以及‘pm2.5’,存储为csv格式文件
三、代码部分
main.py
import scrapy
from ..items import MyDataItem


class MainSpider(scrapy.Spider):
    name = 'main'
    # allowed_domains = ['http://www.tianqihoubao.com']
    # start_urls = ['http://www.tianqihoubao.com/aqi/']

    # start_urls = ['http://www.tianqihoubao.com/aqi/shanghai.html']
    # start_urls = ['http://www.tianqihoubao.com/aqi/beijing.html']
    # start_urls = ['http://www.tianqihoubao.com/aqi/guangzhou.html']
    start_urls = ['http://www.tianqihoubao.com/aqi/shenzhen.html']


    #想法很美好能力不行啊诶,问题是不知道如何分开存储四个城市的数据,只能半手动了,希望以后可以解决!
    # def parse(self, response):
    #     urls = response.xpath('//*[@id="content"]/div[2]/dl[1]/dd//a/@href').extract()
    #     for url in urls:
    #         # if 'beijing' in url:
    #         #     yield scrapy.Request(response.urljoin(url), callback=self.parse_one)
    #         if 'shanghai' in url:
    #             yield scrapy.Request(response.urljoin(url), callback=self.parse_one)
    #         # elif 'guangzhou' in url:
    #         #     yield scrapy.Request(response.urljoin(url), callback=self.parse_one)
    #         # elif 'shenzhen' in url:
    #         #     yield scrapy.Request(response.urljoin(url), callback=self.parse_one)
    #         else:
    #             continue

    def parse(self, response):
        urls =  response.css('a[title*="2020"]::attr(href)').extract()
        for url in urls:
            yield scrapy.Request(response.urljoin(url), callback=self.parse_two)


    def parse_two(self,response):
        sel = response.css('div.wdetail')
        res =  sel.css('tr td::text').extract()
        res = [i.strip() for i in res if i.strip() != '']
        item = MyDataItem()
        item['date'] = res[::10]
        item['aqi'] = res[2::10]
        item['pm_2_5'] = res[4::10]
        item['result'] = list(zip(item['date'],item['aqi'],item['pm_2_5']))

        yield item
items.py
import scrapy


class MyDataItem(scrapy.Item):
    # define the fields for your item here like:
    # name = scrapy.Field()
    date = scrapy.Field()
    aqi = scrapy.Field()
    pm_2_5 = scrapy.Field()
    result = scrapy.Field()
pipelines.py
import csv

class CsvWriterPipeline_result(object):

    def __init__(self):
        # self.file = open('shanghai.csv', 'a',encoding='utf-8',newline='')
        # self.file = open('beijing.csv', 'a',encoding='utf-8',newline='')
        # self.file = open('guangzhou.csv', 'a',encoding='utf-8',newline='')
        self.file = open('shenzhen.csv', 'a',encoding='utf-8',newline='')
        self.writer = csv.writer(self.file)
        self.writer.writerow(['date','aqi','pm2.5'])

    def process_item(self, item, spider):
        for i in item['result']:
            self.writer.writerow(list(i))
        return item

    def __del__(self):
        self.file.close()
四、可视化部分(代码及结果)
数据准备阶段
import pandas as pd
import numpy as np
import matplotlib.pyplot as plt
import matplotlib

#运行的时候挨个注释运行,怕有数据冲突,我并没有验证过一起运行


shanghai_data = pd.read_csv('../My_data/shanghai.csv')
#按时间顺序排序
shanghai_data['date'] = pd.to_datetime(shanghai_data['date'])
shanghai_data.sort_values('date', inplace=True)
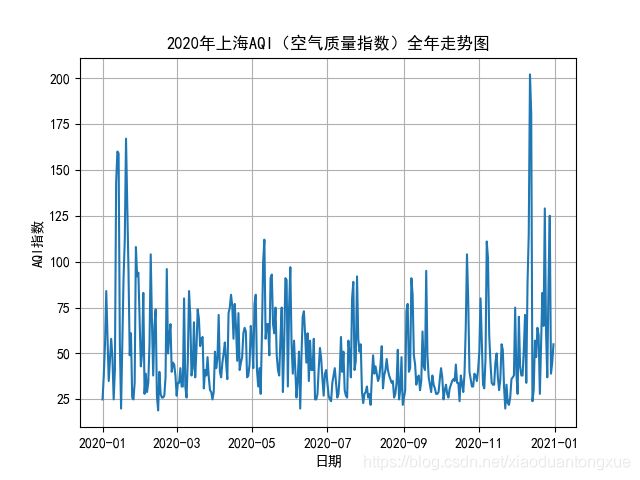
上海空气质量
代码部分:
fig, ax = plt.subplots()
ax.plot(shanghai_data['date'], shanghai_data['aqi'])

ax.set(xlabel='日期', ylabel='AQI指数',
       title='2020年上海AQI(空气质量指数)全年走势图')
ax.grid()

fig.savefig("上海AQI.png")
plt.show()
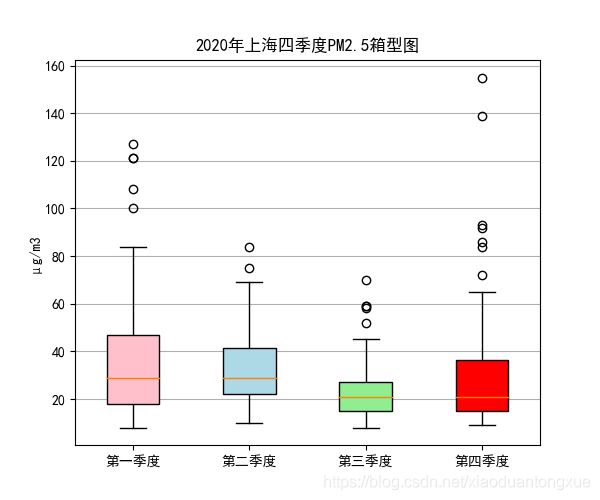
上海PM2.5季度箱型图
代码部分:
# 拆分季度
shanghai_data['quarters'] = shanghai_data['date'].dt.quarter
q1 = shanghai_data[shanghai_data.quarters == 1]
q2 = shanghai_data[shanghai_data.quarters == 2]
q3 = shanghai_data[shanghai_data.quarters == 3]
q4 = shanghai_data[shanghai_data.quarters == 4]


all_data = [  np.array(q1['pm2.5']),
              np.array(q2['pm2.5']),
              np.array(q3['pm2.5']),
              np.array(q4['pm2.5']),
            ]

labels = ['第一季度',
          '第二季度',
          '第三季度',
          '第四季度']

fig, ax1 = plt.subplots(figsize=(6,5))


bplot1 = ax1.boxplot(all_data,
                     vert=True,
                     patch_artist=True,
                     labels=labels)
ax1.set_title('2020年上海四季度PM2.5箱型图')


colors = ['pink', 'lightblue', 'lightgreen','red']
for patch, color in zip(bplot1['boxes'], colors):
    patch.set_facecolor(color)


ax1.yaxis.grid(True)
ax1.set_ylabel('μg/m3')

fig.savefig("上海PM2.5季度箱型图.png")
plt.show()
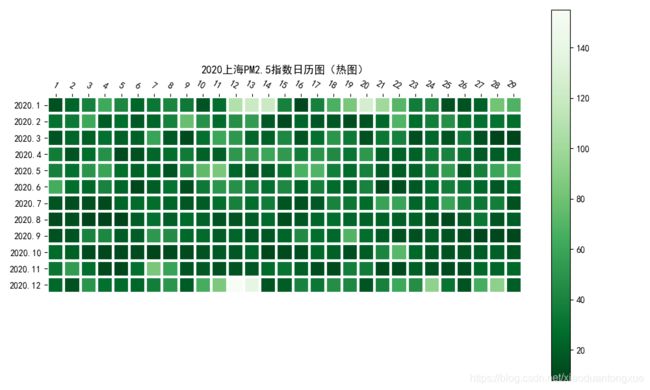
上海PM2.5指数热图
代码部分:
def heatmap(data, row_labels, col_labels, ax=None,
            cbar_kw={}, cbarlabel="", **kwargs):
    if not ax:
        ax = plt.gca()

    # Plot the heatmap
    im = ax.imshow(data, **kwargs)

    # Create colorbar
    cbar = ax.figure.colorbar(im, ax=ax, **cbar_kw)
    cbar.ax.set_ylabel(cbarlabel, rotation=-90, va="bottom")

    # We want to show all ticks...
    ax.set_xticks(np.arange(data.shape[1]))
    ax.set_yticks(np.arange(data.shape[0]))
    # ... and label them with the respective list entries.
    ax.set_xticklabels(col_labels)
    ax.set_yticklabels(row_labels)

    # Let the horizontal axes labeling appear on top.
    ax.tick_params(top=True, bottom=False,
                   labeltop=True, labelbottom=False)

    # Rotate the tick labels and set their alignment.
    plt.setp(ax.get_xticklabels(), rotation=-30, ha="right",
             rotation_mode="anchor")

    # Turn spines off and create white grid.
    ax.spines[:].set_visible(False)

    ax.set_xticks(np.arange(data.shape[1]+1)-.5, minor=True)
    ax.set_yticks(np.arange(data.shape[0]+1)-.5, minor=True)
    ax.grid(which="minor", color="w", linestyle='-', linewidth=3)
    ax.tick_params(which="minor", bottom=False, left=False)

    return im, cbar


def annotate_heatmap(im, data=None, valfmt="{x:.2f}",
                     textcolors=("black", "white"),
                     threshold=None, **textkw):
    if not isinstance(data, (list, np.ndarray)):
        data = im.get_array()

    # Normalize the threshold to the images color range.
    if threshold is not None:
        threshold = im.norm(threshold)
    else:
        threshold = im.norm(data.max())/2.

    # Set default alignment to center, but allow it to be
    # overwritten by textkw.
    kw = dict(horizontalalignment="center",
              verticalalignment="center")
    kw.update(textkw)

    # Get the formatter in case a string is supplied
    if isinstance(valfmt, str):
        valfmt = matplotlib.ticker.StrMethodFormatter(valfmt)

    # Loop over the data and create a `Text` for each "pixel".
    # Change the text's color depending on the data.
    texts = []
    for i in range(data.shape[0]):
        for j in range(data.shape[1]):
            kw.update(color=textcolors[int(im.norm(data[i, j]) > threshold)])
            text = im.axes.text(j, i, valfmt(data[i, j], None), **kw)
            texts.append(text)

    return texts


#感觉有步骤重复了,不熟悉热图的画法,不想改了
date = [f'2020.{i}' for i in range(1,13) ]
day = [f'{i}' for i in range(1,30)]

shanghai_data['pm2.5_float']= pd.DataFrame(data=shanghai_data['pm2.5'], dtype=np.float32)
grouped = shanghai_data['pm2.5_float'].groupby(shanghai_data['date'].apply(lambda x:x.month))

res = [list(i[1]) for i in grouped]
data_res = list(zip(    res[0],
                        res[1],
                        res[2],
                        res[3],
                        res[4],
                        res[5],
                        res[6],
                        res[7],
                        res[8],
                        res[9],
                        res[10],
                        res[11],
                        ))
data_res = [list(i) for i in data_res]
data_res = np.array(data_res).T

fig, ax = plt.subplots(figsize = (10,6))

im, cbar = heatmap(data_res, date, day, ax=ax,
                   cmap=plt.get_cmap('Greens_r'))

#不能加数值了,太糊了
# texts = annotate_heatmap(im, valfmt="{x:.2f} t")

ax.set_title('2020上海PM2.5指数日历图(热图)')
fig.tight_layout()

fig.savefig("上海PM2.5指数日历图(热图).png")
plt.show()
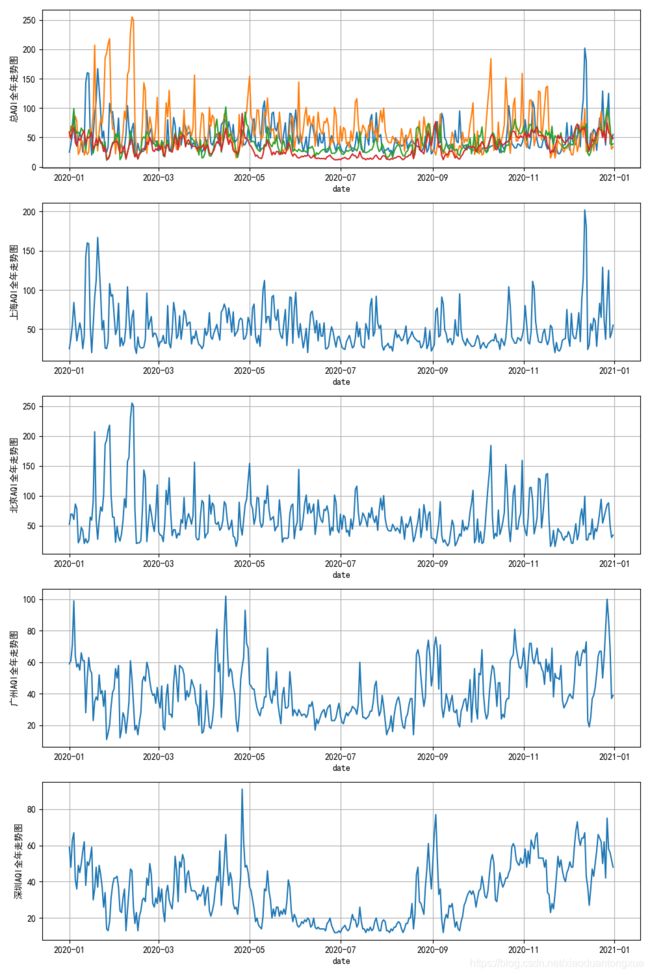
2020北上广深AQI全年走势
代码部分:
beijing_data = pd.read_csv('../My_data/beijing.csv')
#按时间顺序排序
beijing_data['date'] = pd.to_datetime(beijing_data['date'])
beijing_data.sort_values('date', inplace=True)

guangzhou_data = pd.read_csv('../My_data/guangzhou.csv')
#按时间顺序排序
guangzhou_data['date'] = pd.to_datetime(guangzhou_data['date'])
guangzhou_data.sort_values('date', inplace=True)

shenzhen_data = pd.read_csv('../My_data/shenzhen.csv')
#按时间顺序排序
shenzhen_data['date'] = pd.to_datetime(shenzhen_data['date'])
shenzhen_data.sort_values('date', inplace=True)


fig, ax = plt.subplots(5,1,figsize=(10,15))
ax[0].plot(shanghai_data['date'], shanghai_data['aqi'],
           beijing_data['date'], beijing_data['aqi'],
           guangzhou_data['date'], guangzhou_data['aqi'],
           shenzhen_data['date'], shenzhen_data['aqi'])
ax[0].set_xlabel('date')
ax[0].set_ylabel('总AQI全年走势图')
ax[0].grid(True)

ax[1].plot(shanghai_data['date'], shanghai_data['aqi'])
ax[1].set_xlabel('date')
ax[1].set_ylabel('上海AQI全年走势图')
ax[1].grid(True)

ax[2].plot(beijing_data['date'], beijing_data['aqi'])
ax[2].set_xlabel('date')
ax[2].set_ylabel('北京AQI全年走势图')
ax[2].grid(True)

ax[3].plot(guangzhou_data['date'], guangzhou_data['aqi'])
ax[3].set_xlabel('date')
ax[3].set_ylabel('广州AQI全年走势图')
ax[3].grid(True)

ax[4].plot(shenzhen_data['date'], shenzhen_data['aqi'])
ax[4].set_xlabel('date')
ax[4].set_ylabel('深圳AQI全年走势图')
ax[4].grid(True)

fig.tight_layout()
fig.savefig("2020年北上广深AQI全年走势图.png")
plt.show()
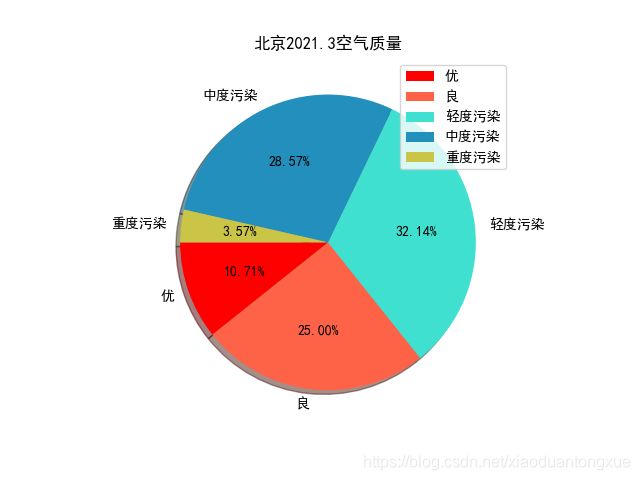
2021.3北京空气质量饼图
import collections
#当初忘记爬取空气质量了,不想爬了,随便找一个月的空气质量画个图吧

#北京2021.3空气质量
air_quality = ['优','良','轻度污染','中度污染','中度污染','优','良','轻度污染','中度污染','重度污染','中度污染',
               '轻度污染','轻度污染','中度污染','严重污染','轻度污染','中度污染','良','良','优','轻度污染',
               '良','轻度污染','良','中度污染','中度污染','严重污染','良','轻度污染','轻度污染']
data_count = collections.Counter(air_quality)
labels = ["优",
          "良",
          "轻度污染",
          "中度污染",
          "重度污染"]
data = [data_count[f'{i}'] for i in labels]
colors=['red','tomato','turquoise', '#228fbd','#cbc547']

fig = plt.figure()
plt.pie(data,labels=labels,colors=colors,startangle=180,shadow=True,autopct='%.2f%%')
plt.title('北京2021.3空气质量')
plt.legend()
fig.savefig("2021.3北京空气质量饼图.png")
plt.show()
