Vue + echarts【一个页面中引入多个表】
文章目录
- 页面布局
- 视图初始化
-
- 动态获取标题
- 动态获取图表数据
- 源码
-
- src\views\meeting\report\index.vue
- src\api\report.js
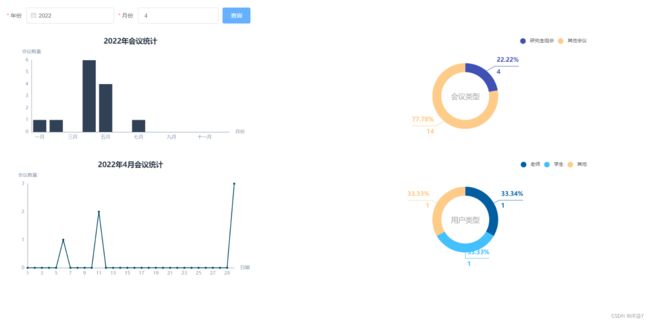
最近在vue项目中添加了一个数据报表界面,在界面中显示多个不同的图,用到了echarts,并且要动态获取数据,在这里记个笔记,效果图如下,文章最后附源码。
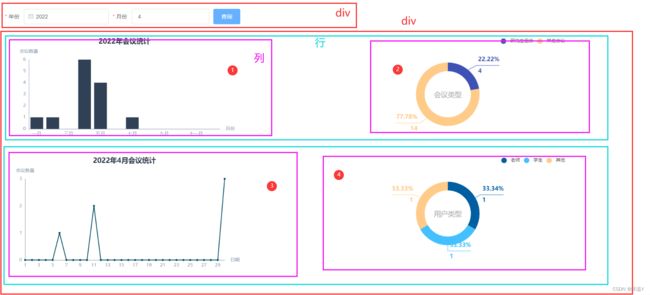
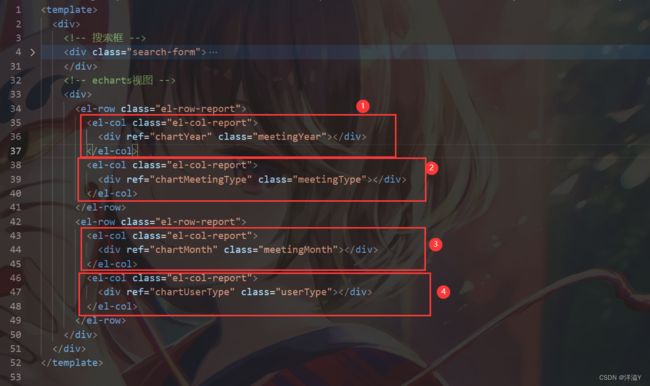
页面布局
<template>
  <div>

    <div class="search-form">
      <el-form
        :inline="true"
        :model="searchForm"
        :rules="searchFormRules"
        ref="searchForm"
      >

        <el-form-item label="年份" prop="year">
          <el-date-picker
            v-model="searchForm.year"
            value-format="yyyy"
            type="year"
            placeholder="请选择年份"
          >
          el-date-picker>
        el-form-item>

        <el-form-item label="月份" prop="month">
          <el-input v-model.number="searchForm.month" placeholder="请输入月份">
          el-input>
        el-form-item>

        <el-form-item>
          <el-button type="primary" @click="search">查询el-button>
        el-form-item>
      el-form>
    div>

    <div>
      <el-row class="el-row-report">
        <el-col class="el-col-report">
          <div ref="chartYear" class="meetingYear">div>
        el-col>
        <el-col class="el-col-report">
          <div ref="chartMeetingType" class="meetingType">div>
        el-col>
      el-row>
      <el-row class="el-row-report">
        <el-col class="el-col-report">
          <div ref="chartMonth" class="meetingMonth">div>
        el-col>
        <el-col class="el-col-report">
          <div ref="chartUserType" class="userType">div>
        el-col>
      el-row>
    div>
  div>
template>
放echarts视图的容器要有大小,才可以显示图表
<style>
.meetingYear {
  width: 100%;
  height: 100%;
}
.meetingMonth {
  width: 100%;
  height: 100%;
}
.meetingType {
  width: 100%;
  height: 100%;
}
.userType {
  width: 100%;
  height: 100%;
}
.el-row-report {
  width: 100%;
  height: auto;
  display: flex;
}
.el-col-report {
  height: 300px;
  margin-top: 10px;
  margin-right: 20px;
  flex: 1;
}
style>
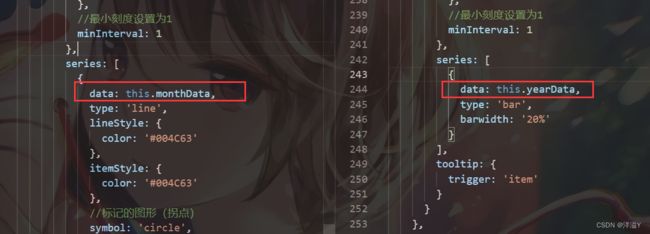
视图初始化
涉及到图表的配置,具体的配置可以看官网,我这里的折线图和柱状图主要是取消了刻度,网格线,然后指定图形颜色
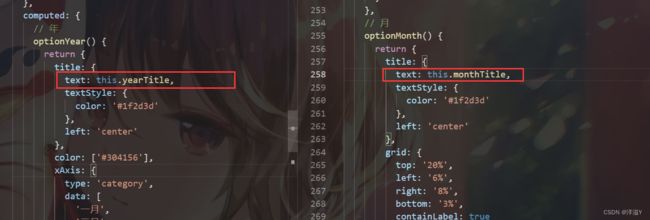
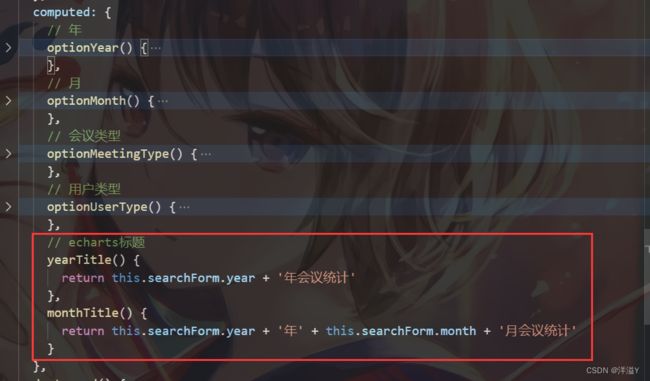
动态获取标题
柱状图和折线图的标题是根据搜索框数据获取的
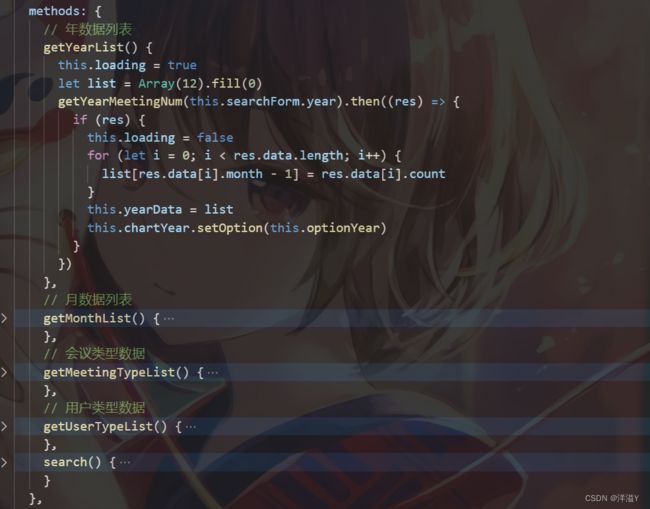
动态获取图表数据
以第一个表为例,就是根据搜索框的值,发送请求,获取数据
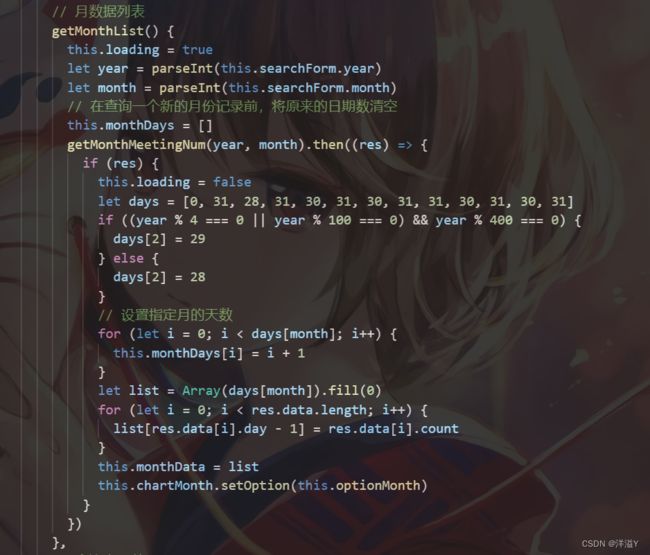
这里有个指定月的数据,每个月天数不一样,我写了判断来获得每个月的天数
  mounted() {
    // 初始化
    // 每年统计
    this.chartYear = echarts.init(this.$refs.chartYear)
    this.chartYear.setOption(this.optionYear)
    // 获取数据
    this.getYearList()

    // 每月统计
    this.chartMonth = echarts.init(this.$refs.chartMonth)
    this.chartMonth.setOption(this.optionMonth)
    // 获取数据
    this.getMonthList()

    // 会议类型
    this.chartMeetingType = echarts.init(this.$refs.chartMeetingType)
    this.chartMeetingType.setOption(this.optionMeetingType)
    // 获取数据
    this.getMeetingTypeList()

    // 用户类型
    this.chartUserType = echarts.init(this.$refs.chartUserType)
    this.chartUserType.setOption(this.optionUserType)
    // 获取数据
    this.getUserTypeList()
  },
    computed: {
    // 年
    optionYear() {
      return {
        title: {
          text: this.yearTitle,
          textStyle: {
            color: '#1f2d3d'
          },
          left: 'center'
        },
        color: ['#304156'],
        xAxis: {
          type: 'category',
          data: [
            '一月',
            '二月',
            '三月',
            '四月',
            '五月',
            '六月',
            '七月',
            '八月',
            '九月',
            '十月',
            '十一月',
            '十二月'
          ],
          axisTick: {
            //去掉x轴刻度
            show: false
          },
          axisLine: {
            lineStyle: {
              color: '#8595a8'
            }
          },
          name: '月份'
        },
        yAxis: {
          type: 'value',
          name: '会议数量',
          //去除网格线
          splitLine: {
            show: false
          },
          axisLine: {
            lineStyle: {
              color: '#8595a8'
            }
          },
          axisTick: {
            show: false
          },
          //最小刻度设置为1
          minInterval: 1
        },
        series: [
          {
            data: this.yearData,
            type: 'bar',
            barwidth: '20%'
          }
        ],
        tooltip: {
          trigger: 'item'
        }
      }
    },
    // 月
    optionMonth() {
      return {
        title: {
          text: this.monthTitle,
          textStyle: {
            color: '#1f2d3d'
          },
          left: 'center'
        },
        grid: {
          top: '20%',
          left: '6%',
          right: '8%',
          bottom: '3%',
          containLabel: true
        },
        xAxis: {
          type: 'category',
          data: this.monthDays,
          boundaryGap: false,
          axisLine: {
            lineStyle: {
              color: '#8595a8'
            }
          },
          axisTick: {
            //去掉x轴刻度
            show: false
          },
          name: '日期'
        },
        yAxis: {
          type: 'value',
          name: '会议数量',
          axisLine: {
            lineStyle: {
              color: '#8595a8'
            }
          },
          axisTick: {
            show: false
          },
          //去除网格线
          splitLine: {
            show: false
          },
          //最小刻度设置为1
          minInterval: 1
        },
        series: [
          {
            data: this.monthData,
            type: 'line',
            lineStyle: {
              color: '#004C63'
            },
            itemStyle: {
              color: '#004C63'
            },
            //标记的图形(拐点)
            symbol: 'circle',
            //大小
            symbolSize: 5
          }
        ],
        tooltip: {
          // axis item none三个值
          trigger: 'axis'
        }
      }
    },
    // 会议类型
    optionMeetingType() {
      return {
        title: {
          subtext: '会议类型',
          left: 'center',
          top: '43%',
          subtextStyle: {
            fontSize: 18
          }
        },
        tooltip: {
          trigger: 'item'
        },
        legend: {
          icon: 'circle',
          top: '0',
          left: 'right'
        },
        series: [
          {
            name: '会议数量',
            type: 'pie',
            radius: ['40%', '55%'],
            label: {
              show: true,
              padding: [0, -60],
              overflow: 'none',
              fontSize: '15',
              fontWeight: 'bold',
              formatter: '{d}%\n\n{c}'
            },
            labelLine: {
              show: true,
              length: 15,
              length2: 60
            },
            itemStyle: {
              normal: {
                color: function (params) {
                  var colorList = ['#3f51b5', '#ffcb89']
                  return colorList[params.dataIndex]
                }
              }
            },
            data: this.meetingTypeData
          }
        ]
      }
    },
    // 用户类型
    optionUserType() {
      return {
        title: {
          subtext: '用户类型',
          left: 'center',
          top: '43%',
          subtextStyle: {
            fontSize: 18
          }
        },
        tooltip: {
          trigger: 'item'
        },
        legend: {
          icon: 'circle',
          top: '0',
          left: 'right'
        },
        series: [
          {
            name: '用户数量',
            type: 'pie',
            radius: ['40%', '55%'],
            label: {
              show: true,
              padding: [0, -60],
              overflow: 'none',
              fontSize: '15',
              fontWeight: 'bold',
              formatter: '{d}%\n\n{c}'
            },
            labelLine: {
              show: true,
              length: 15,
              length2: 60
            },
            itemStyle: {
              normal: {
                color: function (params) {
                  var colorList = ['#005ea1', '#45c0ff', '#ffcb89']
                  return colorList[params.dataIndex]
                }
              }
            },
            data: this.userTypeData
          }
        ]
      }
    },
    // echarts标题
    yearTitle() {
      return this.searchForm.year + '年会议统计'
    },
    monthTitle() {
      return this.searchForm.year + '年' + this.searchForm.month + '月会议统计'
    }
  },
源码
src\views\meeting\report\index.vue
<template>
  <div>
    <!-- 搜索框 -->
    <div class="search-form">
      <el-form
        :inline="true"
        :model="searchForm"
        :rules="searchFormRules"
        ref="searchForm"
      >
        <!-- 年份输入框 -->
        <el-form-item label="年份" prop="year">
          <el-date-picker
            v-model="searchForm.year"
            value-format="yyyy"
            type="year"
            placeholder="请选择年份"
          >
          </el-date-picker>
        </el-form-item>
        <!-- 月份输入框 -->
        <el-form-item label="月份" prop="month">
          <el-input v-model.number="searchForm.month" placeholder="请输入月份">
          </el-input>
        </el-form-item>
        <!-- 查询按钮 -->
        <el-form-item>
          <el-button type="primary" @click="search">查询</el-button>
        </el-form-item>
      </el-form>
    </div>
    <!-- echarts视图 -->
    <div>
      <el-row class="el-row-report">
        <el-col class="el-col-report">
          <div ref="chartYear" class="meetingYear"></div>
        </el-col>
        <el-col class="el-col-report">
          <div ref="chartMeetingType" class="meetingType"></div>
        </el-col>
      </el-row>
      <el-row class="el-row-report">
        <el-col class="el-col-report">
          <div ref="chartMonth" class="meetingMonth"></div>
        </el-col>
        <el-col class="el-col-report">
          <div ref="chartUserType" class="userType"></div>
        </el-col>
      </el-row>
    </div>
  </div>
</template>

<script>
import * as echarts from 'echarts'
import {
  getMonthMeetingNum,
  getYearMeetingNum,
  getMeetingType,
  getUserType
} from '@/api/report'

export default {
  data() {
    return {
      loading: false,
      timer: null,
      // 视图
      chartMonth: null,
      chartYear: null,
      chartMeetingType: null,
      chartUserType: null,
      // 数据
      yearData: [],
      monthData: [],
      meetingTypeData: [],
      userTypeData: [],
      // 查询表单
      searchForm: {
        year: '2022',
        month: '4'
      },
      // 查询表单校验规则
      searchFormRules: {
        year: [{ required: true, message: '请选择年份' }],
        month: [
          { required: true, message: '请输入月份' },
          { type: 'number', message: '请输入正确月份', min: 1, max: 12 }
        ]
      },
      // 每月天数
      monthDays: []
    }
  },
  mounted() {
    // 初始化
    // 每年统计
    this.chartYear = echarts.init(this.$refs.chartYear)
    this.chartYear.setOption(this.optionYear)
    this.getYearList()

    // 每月统计
    this.chartMonth = echarts.init(this.$refs.chartMonth)
    this.chartMonth.setOption(this.optionMonth)
    this.getMonthList()

    // 会议类型
    this.chartMeetingType = echarts.init(this.$refs.chartMeetingType)
    this.chartMeetingType.setOption(this.optionMeetingType)
    this.getMeetingTypeList()

    // 用户类型
    this.chartUserType = echarts.init(this.$refs.chartUserType)
    this.chartUserType.setOption(this.optionUserType)
    this.getUserTypeList()
  },
  methods: {
    // 年数据列表
    getYearList() {
      this.loading = true
      let list = Array(12).fill(0)
      getYearMeetingNum(this.searchForm.year).then((res) => {
        if (res) {
          this.loading = false
          for (let i = 0; i < res.data.length; i++) {
            list[res.data[i].month - 1] = res.data[i].count
          }
          this.yearData = list
          this.chartYear.setOption(this.optionYear)
        }
      })
    },
    // 月数据列表
    getMonthList() {
      this.loading = true
      let year = parseInt(this.searchForm.year)
      let month = parseInt(this.searchForm.month)
      // 在查询一个新的月份记录前,将原来的日期数清空
      this.monthDays = []
      getMonthMeetingNum(year, month).then((res) => {
        if (res) {
          this.loading = false
          let days = [0, 31, 28, 31, 30, 31, 30, 31, 31, 30, 31, 30, 31]
          if ((year % 4 === 0 || year % 100 === 0) && year % 400 === 0) {
            days[2] = 29
          } else {
            days[2] = 28
          }
          // 设置指定月的天数
          for (let i = 0; i < days[month]; i++) {
            this.monthDays[i] = i + 1
          }
          let list = Array(days[month]).fill(0)
          for (let i = 0; i < res.data.length; i++) {
            list[res.data[i].day - 1] = res.data[i].count
          }
          this.monthData = list
          this.chartMonth.setOption(this.optionMonth)
        }
      })
    },
    // 会议类型数据
    getMeetingTypeList() {
      getMeetingType().then((res) => {
        if (res) {
          this.meetingTypeData = res.data
          this.chartMeetingType.setOption(this.optionMeetingType)
        }
      })
    },
    // 用户类型数据
    getUserTypeList() {
      getUserType().then((res) => {
        if (res) {
          this.userTypeData = res.data
          this.chartUserType.setOption(this.optionUserType)
        }
      })
    },
    search() {
      this.getYearList()
      this.getMonthList()
    }
  },
  computed: {
    // 年
    optionYear() {
      return {
        title: {
          text: this.yearTitle,
          textStyle: {
            color: '#1f2d3d'
          },
          left: 'center'
        },
        color: ['#304156'],
        xAxis: {
          type: 'category',
          data: [
            '一月',
            '二月',
            '三月',
            '四月',
            '五月',
            '六月',
            '七月',
            '八月',
            '九月',
            '十月',
            '十一月',
            '十二月'
          ],
          axisTick: {
            //去掉x轴刻度
            show: false
          },
          axisLine: {
            lineStyle: {
              color: '#8595a8'
            }
          },
          name: '月份'
        },
        yAxis: {
          type: 'value',
          name: '会议数量',
          //去除网格线
          splitLine: {
            show: false
          },
          axisLine: {
            lineStyle: {
              color: '#8595a8'
            }
          },
          axisTick: {
            show: false
          },
          //最小刻度设置为1
          minInterval: 1
        },
        series: [
          {
            data: this.yearData,
            type: 'bar',
            barwidth: '20%'
          }
        ],
        tooltip: {
          trigger: 'item'
        }
      }
    },
    // 月
    optionMonth() {
      return {
        title: {
          text: this.monthTitle,
          textStyle: {
            color: '#1f2d3d'
          },
          left: 'center'
        },
        grid: {
          top: '20%',
          left: '6%',
          right: '8%',
          bottom: '3%',
          containLabel: true
        },
        xAxis: {
          type: 'category',
          data: this.monthDays,
          boundaryGap: false,
          axisLine: {
            lineStyle: {
              color: '#8595a8'
            }
          },
          axisTick: {
            //去掉x轴刻度
            show: false
          },
          name: '日期'
        },
        yAxis: {
          type: 'value',
          name: '会议数量',
          axisLine: {
            lineStyle: {
              color: '#8595a8'
            }
          },
          axisTick: {
            show: false
          },
          //去除网格线
          splitLine: {
            show: false
          },
          //最小刻度设置为1
          minInterval: 1
        },
        series: [
          {
            data: this.monthData,
            type: 'line',
            lineStyle: {
              color: '#004C63'
            },
            itemStyle: {
              color: '#004C63'
            },
            //标记的图形(拐点)
            symbol: 'circle',
            //大小
            symbolSize: 5
          }
        ],
        tooltip: {
          // axis item none三个值
          trigger: 'axis'
        }
      }
    },
    // 会议类型
    optionMeetingType() {
      return {
        title: {
          subtext: '会议类型',
          left: 'center',
          top: '43%',
          subtextStyle: {
            fontSize: 18
          }
        },
        tooltip: {
          trigger: 'item'
        },
        legend: {
          icon: 'circle',
          top: '0',
          left: 'right'
        },
        series: [
          {
            name: '会议数量',
            type: 'pie',
            radius: ['40%', '55%'],
            label: {
              show: true,
              padding: [0, -60],
              overflow: 'none',
              fontSize: '15',
              fontWeight: 'bold',
              formatter: '{d}%\n\n{c}'
            },
            labelLine: {
              show: true,
              length: 15,
              length2: 60
            },
            itemStyle: {
              normal: {
                color: function (params) {
                  var colorList = ['#3f51b5', '#ffcb89']
                  return colorList[params.dataIndex]
                }
              }
            },
            data: this.meetingTypeData
          }
        ]
      }
    },
    // 用户类型
    optionUserType() {
      return {
        title: {
          subtext: '用户类型',
          left: 'center',
          top: '43%',
          subtextStyle: {
            fontSize: 18
          }
        },
        tooltip: {
          trigger: 'item'
        },
        legend: {
          icon: 'circle',
          top: '0',
          left: 'right'
        },
        series: [
          {
            name: '用户数量',
            type: 'pie',
            radius: ['40%', '55%'],
            label: {
              show: true,
              padding: [0, -60],
              overflow: 'none',
              fontSize: '15',
              fontWeight: 'bold',
              formatter: '{d}%\n\n{c}'
            },
            labelLine: {
              show: true,
              length: 15,
              length2: 60
            },
            itemStyle: {
              normal: {
                color: function (params) {
                  var colorList = ['#005ea1', '#45c0ff', '#ffcb89']
                  return colorList[params.dataIndex]
                }
              }
            },
            data: this.userTypeData
          }
        ]
      }
    },
    // echarts标题
    yearTitle() {
      return this.searchForm.year + '年会议统计'
    },
    monthTitle() {
      return this.searchForm.year + '年' + this.searchForm.month + '月会议统计'
    }
  },
  destroyed() {
    clearInterval(this.timer)
  }
}
</script>

<style>
.meetingYear {
  width: 100%;
  height: 100%;
}
.meetingMonth {
  width: 100%;
  height: 100%;
}
.meetingType {
  width: 100%;
  height: 100%;
}
.userType {
  width: 100%;
  height: 100%;
}
.el-row-report {
  width: 100%;
  height: auto;
  display: flex;
}
.el-col-report {
  height: 300px;
  margin-top: 10px;
  margin-right: 20px;
  flex: 1;
}
</style>
src\api\report.js
// 大屏数据
import {
  axios
} from '@/utils/request'

// 每年
export function getYearMeetingNum(year) {
  return axios({
    url: '/api/v1/report/year/' + year,
    method: 'get',
  })
}

// 每月
export function getMonthMeetingNum(year, month) {
  return axios({
    url: `/api/v1/report/year/${year}/month/${month}`,
    method: 'get',
  })
}

// 会议类型
export function getMeetingType() {
  return axios({
    url: '/api/v1/report/meetingType',
    method: 'get'
  })
}

// 用户类型
export function getUserType() {
  return axios({
    url: '/api/v1/report/userType',
    method: 'get'
  })
}